Move over, Miami: Chicago is America’s hottest rental market this peak season
Share this article:


After years of watching the coasts and the Sun Belt set the tone, the center of the rental map has moved to the Midwest and there’s a new name at the top of the list this peak rental season. Chicago overtakes Miami as the most competitive rental market in the country, with about 17 renters lining up for every available apartment and vacant apartments filling in 27 days — the fastest of any large market.
Nationally, the picture is more mixed. Although renting is slightly easier than it was last summer, the relief is unevenly spread. Construction has thinned to the point where newly built apartments make up just 0.5% of all rentals, so the markets where demand is still climbing feel tighter than ever.
Whether your search will be a sprint or a stroll now depends largely on where you’re looking. Here’s where demand is fiercest at the peak of the 2026 rental season, where it’s easing and what’s behind the biggest moves.
Key takeaways:
- Chicago is the hottest large rental market in the country with a Rental Competitiveness Index (RCI) score of 91.8 and about 17 renters competing for every available apartment.
- Tech hubs are gaining heat the fastest. Silicon Valley posted the largest year-over-year jump among large markets at 7.6 points, followed closely by Chicago, the San Francisco Peninsula and Milwaukee.
- Lehigh Valley, PA, leads the small markets with an RCI score of 89 with Amarillo, TX, and Palm Beach County, FL, right behind.
- Manhattan, NY, climbed into the top five large markets, with the Big Apple coming in with nearly 96% of apartments occupied and demand that keeps outpacing new supply.
- The Northeast (RCI score: 80.4) is the most competitive region for renters, edging out Florida and the Midwest.
- Some markets are cooling: Eastern Los Angeles County saw the steepest year-over-year competitiveness score drop, handing renters there some real breathing room.
Where is it hardest to rent this peak season? To find out, RentCafe.com analyzed Yardi data across 139 of the largest U.S. markets using five factors:
- How many renters competed for each available apartment
- How many renters decided to renew and stay put
- How long it took for an apartment to fill
- The share of apartments that were occupied
- The share of apartments that were newly built
Renting is a point easier than last summer — but there’s a catch
The U.S. rental market hits the peak of the moving season with an RCI score of 73.9 out of 100, down from 74.6 a year ago. A dip of about a point is welcome news if you’re searching right now, but a score above 70 still means that most markets lean competitive, rather than comfortable.
The numbers underneath show where that breathing room comes from. There are nine renters vying for each vacant apartment, on par with last summer. Apartments take 42 days to fill, on average (up from 40 one year ago) and occupancy edged down to 92.9% from 93.4%. Meanwhile, renewals held steady, with 62.8% of renters choosing to stay put compared with 62.7% last year.
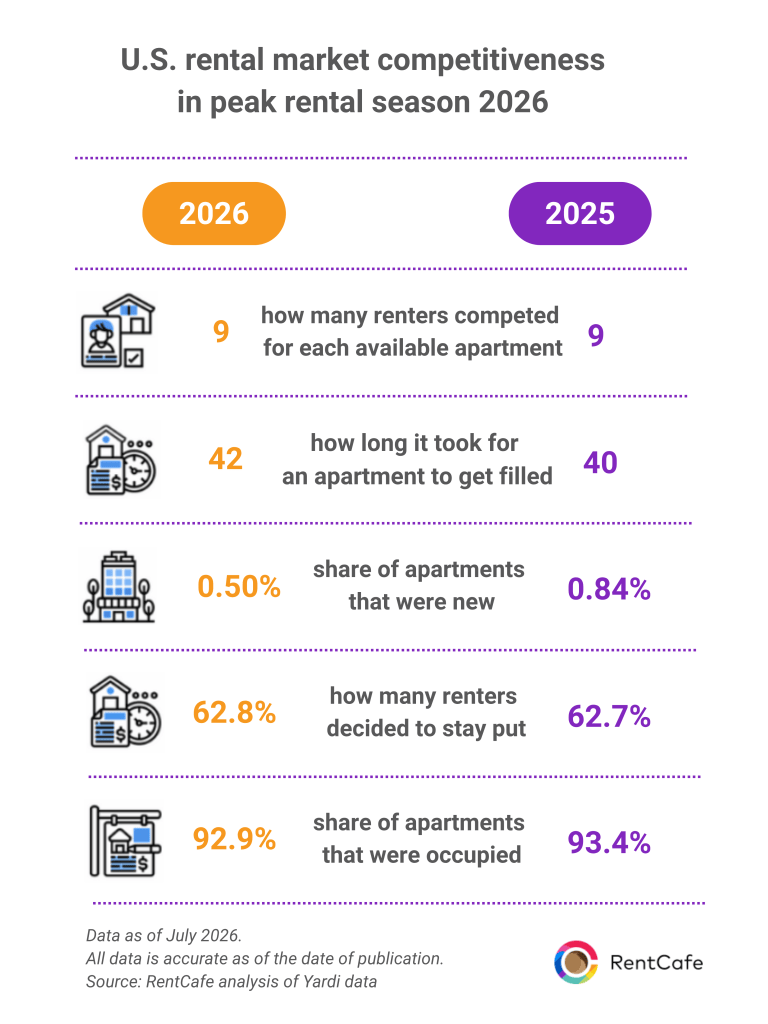
The catch is supply: Newly built apartments now represent just 0.5% of all rentals nationwide (down from 0.8% a year ago) as the construction wave of the last few years winds down.
That’s why the national easing feels real in some places and invisible in others. For instance, in 28 of the 66 large markets analyzed, at least four of the five metrics moved in renters’ favor year-over-year. Yet, in many others, thinner pipelines are canceling out the relief. California is the clearest example: The state’s markets average about 12 prospective renters per opening — more than any other region — even though low renewal rates keep its overall score in the middle of the pack.
Chicago overtakes Miami as most in-demand rental market
If you’re apartment-hunting in Chicago, you’re not imagining the crowd at every showing. The city posts an RCI score of 91.8 — the highest of any market analyzed — with about 17 prospective renters per vacancy, in addition to more than 95% of apartments occupied and rentals filling in 27 days.
Supply is the story here: Newly built units account for just 0.27% of the local stock, and apartment deliveries across the region are expected to fall below 4,000 units this year — the lowest level since 2012.
What’s more, the metro is short roughly 165,000 homes, so every opening draws heavy interest. The pressure holds on both sides of the city line, too, with Suburban Chicago fifth at 85.4, thanks to a 70.8% renewal rate.
Next, Miami, which lead at the start of the season, slips to second place with an RCI score of 89.8. Even so, it’s hardly an easy place to land a lease: About 16 renters compete for each opening; nearly 96% of apartments are taken; and 70% of renters renew, rather than move.
Top 30 most competitive rental markets
in peak rental season 2026
| Rank | Market | Competitive score |
Average vacant days |
Occupied apartments |
Prospective renters |
Lease renewal rate |
Share of new units |
|---|---|---|---|---|---|---|---|
| 1 | Chicago, IL | 91.8 | 27 | 95.4% | 17 | 0.27% | |
| 2 | Miami, FL | 89.8 | 36 | 96.0% | 16 | 0.12% | |
| 3 | Silicon Valley, CA | 85.6 | 34 | 95.9% | 15 | 0.17% | |
| 4 | Manhattan, NY | 85.4 | 37 | 96.0% | 12 | 0.05% | |
| 4 | Suburban Chicago, IL | 85.4 | 37 | 94.9% | 13 | 0.34% | |
| 6 | Grand Rapids, MI | 85.0 | 33 | 95.4% | 11 | 0.40% | |
| 7 | Milwaukee, WI | 83.8 | 33 | 94.8% | 11 | 0.78% | |
| 8 | Suburban Twin Cities, MN-WI | 81.6 | 38 | 94.6% | 12 | 0.56% | |
| 9 | Suburban Philadelphia, PA | 81.3 | 44 | 94.3% | 10 | 0.21% | |
| 10 | Twin Cities, MN | 81.2 | 39 | 93.3% | 11 | 0.04% | |
| 11 | Broward County, FL | 80.8 | 40 | 95.0% | 13 | 0.57% | |
| 12 | Lansing – Ann Arbor, MI |
80.3 | 37 | 94.4% | 8 | 0.26% | |
| 12 | Kansas City, MO | 80.3 | 39 | 93.2% | 9 | 0.20% | |
| 14 | Eastern Virginia, VA | 79.5 | 39 | 93.8% | 11 | 0.46% | |
| 15 | Pittsburgh, PA | 78.8 | 41 | 93.9% | 9 | 0.25% | |
| 16 | Orange County, CA | 78.4 | 45 | 95.4% | 11 | 0.04% | |
| 17 | Omaha, NE | 78.3 | 38 | 94.0% | 9 | 0.44% | |
| 18 | North Jersey, NJ | 78.0 | 41 | 94.9% | 10 | 0.84% | |
| 19 | Cincinnati, OH | 77.5 | 43 | 93.5% | 11 | 0.39% | |
| 19 | East Bay, CA | 77.5 | 41 | 94.7% | 12 | 0.15% | |
| 19 | Detroit, MI | 77.5 | 44 | 93.0% | 8 | 0.13% | |
| 22 | San Francisco Peninsula – North Bay, CA |
77.3 | 40 | 95.1% | 14 | 0.37% | |
| 22 | Queens, NY | 77.3 | 37 | 95.2% | 11 | 0.91% | |
| 24 | Baltimore, MD | 77.0 | 47 | 93.1% | 8 | 0.00% | |
| 25 | Jacksonville, FL | 76.5 | 42 | 92.5% | 9 | 0.24% | |
| 26 | Brooklyn, NY | 76.4 | 39 | 94.6% | 10 | 1.13% | |
| 27 | Bridgeport – New Haven, CT |
75.5 | 44 | 93.8% | 10 | 0.25% | |
| 27 | Central Valley, CA | 75.5 | 43 | 95.7% | 12 | 0.19% | |
| 29 | Louisville, KY | 75.1 | 42 | 92.7% | 8 | 0.24% | |
| 30 | Greater Boston, MA | 75.0 | 41 | 94.3% | 11 | 0.89% |
Source: RentCafe analysis of Yardi data

Silicon Valley holds third (RCI score: 85.6) after moving up 10 positions since this time last year, while Manhattan, NY, edges up one spot since last quarter to rank fourth (RCI score: 85.4), with 96% of apartments occupied — the highest rate among large markets — and next to no new supply reaching renters.
Notably, the bigger pattern is regional: Six of the 10 toughest large markets are in the Midwest, including Grand Rapids, MI, in sixth; Milwaukee in seventh; and Minnesota’s Suburban Twin Cities in eighth.
That helps the Midwest (RCI score: 80.3) overtake the Northeast (78.8) as the hottest region in the country, with Florida (76.3) finishing in third. Midwestern apartments fill faster than anywhere else — averaging about 38 days — as affordable rents keep drawing people in and convincing them to stay.

What stands out at the peak of the season is how local this market has become. Nationally, renters have a bit more breathing room than a year ago. But construction has slowed so much in places like Chicagoland, Northern California and the smaller Midwest metros that the apartments that do open up are gone faster than the 42-day national average. Where you search now matters more than when.
California’s larger markets tightening fastest
The four biggest year-over-year gains among large markets all belong to California, and they trace a single storyline — the Bay Area’s tech rebound. East Bay jumped 7.7 points to 77.5, climbing 36 positions to 20th — the biggest rank move of any large market. Central Valley rose 5.9 points to 28th, Silicon Valley added 5.3 points on its way to third nationwide and the San Francisco Peninsula gained 4.9 points to reach 22nd.
The demand engine is artificial intelligence. According to CBRE, AI companies have leased 21 million square feet of office space across San Francisco and Silicon Valley since 2019. Moreover, tech firms accounted for 22.7% of all U.S. office leasing in the first quarter of 2026 — a surge that’s pulling workers back to the region and straight into its apartment market.
With office demand topping 5 million square feet in both San Francisco and Silicon Valley, that pull isn’t letting up. Meanwhile, new apartments are scarce, and renters priced out of the two metros are pushing demand into the East Bay and inland toward the Central Valley.
Top 10 trending rental markets in peak rental season 2026
North Bay, CA
Data as of July 2026. All data is accurate as of the date of publication.
Source: RentCafe analysis of Yardi data
The rebound isn’t limited only to California — two other moves stand out. Austin, TX, which spent the past two years favoring renters, gained 4.1 points as its supply wave finally receded. And the Twin Cities — separate from their suburbs, which rank eighth — jumped 31 spots to crack the top 10. Here, development softened, with about 4,200 units scheduled for delivery in 2026. After roughly 26,000 apartments opened in prior years and with newly built units at nearly zero this quarter, the market snapped from oversupplied to tight.
Small markets: Youngstown, OH, takes lead as America’s heartland tightens
The most in-demand small market in the country is one of its most affordable. Youngstown, OH, jumps from 18th a year ago to first with an RCI score of 87.6, powered by a 77.1% renewal rate, about 17 renters per opening and zero new apartments delivered. In this case, the average rent sits near $1,060 — roughly 40% below the national average of $1,771 — which gives renters every reason to stay. At the same time, manufacturing investment in the Mahoning Valley — anchored by projects like the $800 million Kimberly-Clark manufacturing facility and $62.2 million downtown Aerospace and Defense Innovation Hub — continue to bring new renters to the area.
Amarillo, TX, holds second at 87 after climbing 31 spots and 8.2 points year-over-year for the biggest point gain of any small market. With no new units opened recently, vacant apartments here fill in 22 days — the fastest in the country — as the local economy anchored by aerospace and defense, alongside agriculture and food processing keeps demand steady.
Lehigh Valley, PA (which was the small-market leader at the start of the season), slips to third at 86.9, but still posts the highest renewal rate of any small market at 77.5%.
Top 30 most competitive small rental markets
in peak rental season 2026
| Rank | Market | Competitive score |
Average vacant days |
Occupied apartments |
Prospective renters |
Lease renewal rate |
Share of new units |
|---|---|---|---|---|---|---|---|
| 1 | Youngstown, OH | 87.6 | 41 | 96.0% | 17 | 0.00% | |
| 2 | Amarillo, TX | 87.0 | 22 | 95.5% | 13 | 0.00% | |
| 3 | Lehigh Valley, PA | 86.9 | 39 | 95.9% | 14 | 0.00% | |
| 4 | Wichita, KS | 86.2 | 29 | 95.2% | 12 | 0.00% | |
| 5 | Rochester, MN | 85.7 | 29 | 95.7% | 14 | 0.00% | |
| 6 | Boise, ID | 84.7 | 32 | 96.1% | 21 | 0.74% | |
| 7 | Providence, RI | 83.3 | 45 | 95.7% | 17 | 0.28% | |
| 8 | Harrisburg, PA | 83.0 | 42 | 95.5% | 12 | 0.11% | |
| 9 | Toledo, OH | 82.6 | 37 | 95.7% | 13 | 0.78% | |
| 9 | Portland, ME | 82.6 | 32 | 94.5% | 12 | 0.00% | |
| 11 | Lexington, KY | 82.4 | 39 | 94.5% | 15 | 0.00% | |
| 12 | Palm Beach County, FL | 82.1 | 39 | 94.9% | 14 | 0.00% | |
| 12 | Port St. Lucie, FL | 82.1 | 39 | 95.1% | 11 | 0.00% | |
| 14 | Knoxville, TN | 81.6 | 35 | 94.8% | 12 | 0.00% | |
| 15 | South Bend, IN | 80.9 | 32 | 95.6% | 8 | 1.14% | |
| 15 | Columbus, GA | 80.9 | 37 | 95.0% | 11 | 0.23% | |
| 17 | Fort Wayne, IN | 80.8 | 39 | 94.8% | 9 | 0.00% | |
| 17 | Lubbock, TX | 80.8 | 30 | 94.3% | 11 | 0.00% | |
| 19 | Rochester, NY | 80.5 | 43 | 94.1% | 10 | 0.27% | |
| 20 | South Dakota | 80.4 | 40 | 94.5% | 13 | 0.00% | |
| 21 | Dayton, OH | 79.9 | 37 | 94.6% | 9 | 0.21% | |
| 22 | Columbia, SC | 79.5 | 37 | 93.1% | 13 | 0.14% | |
| 22 | Albany, NY | 79.5 | 47 | 94.9% | 13 | 0.39% | |
| 24 | Fayetteville, AR | 79.3 | 32 | 94.5% | 9 | 1.86% | |
| 24 | Lafayette, IN | 79.3 | 39 | 94.7% | 9 | 0.00% | |
| 26 | Little Rock, AR | 79.2 | 39 | 92.7% | 8 | 0.00% | |
| 27 | Buffalo, NY | 79.0 | 52 | 93.2% | 14 | 0.00% | |
| 28 | Jackson, MS | 78.7 | 38 | 93.3% | 10 | 0.21% | |
| 28 | White Plains, NY | 78.7 | 48 | 95.4% | 16 | 0.32% | |
| 30 | Wilmington, NC | 78.2 | 35 | 93.1% | 9 | 0.00% |
Source: RentCafe analysis of Yardi data
Wichita, KS, returns to fourth after dropping to 20th earlier this year. That said, the brief burst of new deliveries that gave renters extra choice has already tapered off with no new units completed this quarter.
Rochester, MN, rounds out the top five after a 31-spot quarterly climb as Mayo Clinic’s $5 billion downtown campus expansion draws workers faster than new housing can keep up.
In Boise, ID (sixth overall), about 21 renters now compete for every vacancy — the most of any market analyzed — as newcomers from pricier Western states continue moving in. In fact, migration drives most of Idaho’s population growth, while tighter lending holds back new projects.
However, the fastest riser this quarter is Portland, ME, which surges 32 spots since the start of the season to break into the top 10 — the biggest quarterly climb of any small market — with zero new apartments delivered and vacant apartments filling in around a month.
Top 10 trending small rental markets
in peak rental season 2026
Data as of July 2026. All data is accurate as of the date of publication.
Source: RentCafe analysis of Yardi data
Throughout the full year, South Dakota made the biggest climb of any market analyzed, up eight points and 42 positions from last summer as steady demand met a market with almost nothing under construction. Meanwhile, Port St. Lucie, FL — last quarter’s biggest climber — settled back to #13.
Where large-market renters are catching a break: Orlando, FL; Brooklyn, NY; & Nashville, TN, cool down
Not every market is tightening this peak season — some of the largest are moving in renters’ favor. Orlando, FL, cooled the most of any large market, dropping 6.3 points and sliding from 12th to 34th after years of elevated deliveries. Even so, 2026 is also expected to bring a high number of new apartments to this Florida city, albeit at a more moderate pace. Apartments here now take 42 days to fill (up from 36 one year ago), and the number of prospective renters per vacant apartment fell from 11 to nine.
Brooklyn, NY, eased six points year-over-year to 26th after ranking seventh last summer — though it has ticked up slightly since the spring. In this case, newly built apartments make up 1.1% of the local stock — among the highest shares in the country — as the New York metro keeps building.
Nashville, TN, matched that six-point drop and now sits 61st. The metro has added nearly 35,900 units since 2023 and concessions remain common in areas with heavy new apartment construction. Philadelphia (-5.7); Washington, D.C. (-5.2); and Greater Boston (-5.1) round out the biggest declines, with Philadelphia posting the highest share of new apartments of any large market at 1.9% of stock.
If you’re searching in these metros, know that concession use is broadening this year, especially in high-supply metros, so it pays to ask.
Where small-market renters are getting relief: Lafayette, IN; Fayetteville, AR; & Madison, WI, ease up
The sharpest turnarounds of the season belong to two former champions. Lafayette, IN (the top-ranked small market a year ago), fell 14.5 points to 25th. That made for the steepest drop of any market analyzed as fill times stretched from 29 to 39 days and the number of prospective renters per vacancy nearly halved.
Similarly, Fayetteville, AR (last year’s runner-up), slid 14.3 points to 24th as new apartments reached almost 2% of the local stock for one of the highest shares in the study. With that, renters in the fast-growing Northwest Arkansas region have far more choice.
Madison, WI, tells the same story after falling 11.4 points from fifth to 32nd as fresh deliveries tripled the share of new apartments. Renters are also finding more room in Louisiana’s Lafayette-Lake Charles market (-10.5); Savannah, GA (-9.5); Greenville, NC (-9.3); and Asheville, NC (-8.8) — the latter carrying the highest share of newly built units of any market analyzed at 4% of stock. In each case, new apartment deliveries handed renters more choice and more time to decide.
FAQ
A: Among large markets, Chicago leads with an RCI score of 91.8 and about 17 renters vying for every opening. Youngstown, OH, tops the list of hottest small rental markets.
A: Orlando, FL, saw the biggest decline among large markets, with Brooklyn, NY, and Nashville, TN, close behind. Among small markets, Lafayette, IN, and Fayetteville, AR — last year’s top two — posted the steepest drops in the study.
A: California’s East Bay leads large markets with a 7.7-point year-over-year jump, followed by Central Valley, Silicon Valley and the San Francisco Peninsula. Among small markets, Amarillo, TX, posted the biggest point gain and South Dakota had the biggest rank climb.
A: Slightly easier. The U.S. RCI dipped to 73.9 from 74.6 a year ago, although new construction at just 0.5% of all rentals keeps high-demand markets tight.
A: The Midwest leads all regions with an average RCI score of 80.3, overtaking the Northeast. Fast fill times, affordable rents and limited new construction keep vacancies scarce, and six of the 10 most in-demand large markets are in the Midwest.
A: The Rental Competitiveness Index is a score from zero to 100 that combines five things — how long an apartment took to fill, the share of apartments occupied, how many renters competed for each vacancy, how many renters renewed their leases and how much new construction reached the market. The higher the score, the harder it is to land an apartment.
Methodology
To compile this report, RentCafe.com’s research team analyzed Yardi apartment data across 139 rental markets in the U.S. The data comes from market-rate, large-scale, multifamily properties of at least 50 units. Fully affordable multifamily properties were excluded. All data is accurate as of the date of publication.
Markets were ranked on a competitiveness score built from five metrics and their averages for the most recent quarter (April, May, June): apartment occupancy rate, average total days vacant, prospective renters per vacant unit, lease renewal rate and the share of new apartments completed during the same period.
Each metric carries a percentage weight: 30% for occupancy rate, 15% for average vacant days, 15% for prospective renters per vacant unit, 30% for renewal rate and 10% for the share of new apartments. Scores are displayed as rounded to one decimal, while rankings are based on unrounded scores, so markets that appear tied hold different ranks.
Markets above roughly 80,000 units are grouped as large markets and those below as small markets, with the same locations kept consistent year-over-year. The terms “market,” “area,” “metro,” and “location” are used interchangeably and follow Yardi Matrix market definitions.
Fair use and redistribution
We encourage you and freely grant you permission to reuse, host or repost the research, graphics and images presented in this report. When doing so, we ask that you credit our research by linking to RentCafe.com or this page, so that your readers can learn more about this project, the research behind it and its methodology. For more in-depth, customized data, please contact us at media@rentcafe.com.
Share this article:


Florin Petrut
Florin Petrut is a real estate writer and research analyst with RentCafe, using his experience as a social media specialist and love for storytelling to create insightful reports and studies on the rental market. With a strong interest in the renter experience, he develops data-driven resources that explore cost of living, affordable neighborhoods, and housing trends, helping renters make informed decisions about where and how they live. Florin holds a B.A. in Journalism and an M.A. in Digital Media and Game Studies.
Sign up for The Ready Renter newsletter
Get our free apartment hunting guide — plus tips, trends and research.




Related posts

RentCafe Internet connects you to high-speed WiFi and entertainment services in one place
RentCafe partners with leading internet providers to bring reliable internet, streaming and mobile options directly to renters. Applicants and residents can browse and activate available…
How to break a lease without wrecking your finances or your record
Life changes fast. A new job across the country, a growing family, or an unexpected health situation can all make your current apartment feel like…

From dorm to lease: A step-by-step guide to the first apartment rental process
The first apartment rental process is your transition from shared dorm living to renting a place that’s fully yours. It involves setting a realistic budget,…
Subscribe to
The Ready Renter newsletter