The Average National Apartment Rent Kicks Off the Spring Rental Season at $1,430
Share this article:
Key takeaways:
- The national average rent was $1,430 in March 2019, 3.2% ($44) higher than this time last year, according to data from Yardi Matrix.
- 92% of the country’s largest 253 cities have seen rents grow in March year-over-year, 6% of rents remained unchanged, while 2% of cities experienced rent drops compared to 2018.
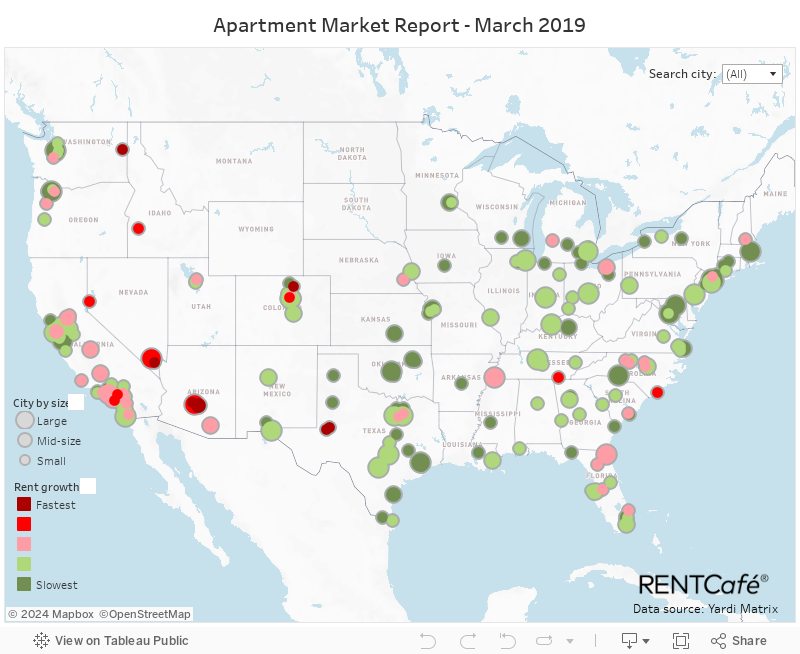
- The fastest and the slowest y-o-y rent changes occurred in small Texas cities — Midland (14.6%) and Odessa (13.3%) are the only cities with increases of over 10%, while Pearland is the only one where rent decreased by more than 2%.

The national average rent in March went up by 3.2% year-over-year
The early beginning of the rental season saw rent prices increase by 3.2% over the year — the lowest annual growth we’ve seen in more than 6 months. Compared to last year’s figure, the March average national rent of $1,430/month is $44 higher. Month-over-month, however, we witnessed a 0.3% rise, or $4 more added to average rent prices. This is consistent to last spring’s growth levels, signaling the end of the sluggish winter season.
Check out the interactive map below to find out more about rent price changes in small, mid-sized, and large U.S. cities
Small cities top both ends of the list of y-o-y rent changes in the U.S.
The most significant year-over-year changes in March 2019 were experienced in small cities across the country. In terms of highest annual rent increases, the national scene is dominated by small cities, with Mesa, AZ the only mid-sized exception. Midland, TX and Odessa, TX continue to reign supreme with increases of 14.6% and 13.3%, respectively. Chandler, AZ, Mesa, AZ, and Henderson, NV are the only other cities to boast annual rent increases of over 9%. At the opposite end of the list are small U.S. cities that registered the slowest rent changes, such as Texas’s Pearland (-2.3%), followed by Santa Rosa, CA and Pembroke Pines, FL (both with a -1.4 decrease).
The 20 largest hubs in the U.S. continue to see rapid rent jumps
Among the largest renter hubs, Phoenix, AZ and Las Vegas, NV boast the sharpest increase over the past year, 7.8%. This increase translates into $1,037/month for rent in Phoenix and $1,055 in Sin City. Los Angeles, CA saw $130 added to the average rent ($2,469), followed by smaller yearly net increases in Brooklyn, NY ($88) and San Diego, CA ($81). Rents in the NYC borough of Brooklyn reached $2,860 in March, while apartments in America’s Finest City rent for $2,155 per month, on average.
Rent in Houston, TX is $1,098 after witnessing the smallest net growth among larger hubs – 0.9%, which is $10 more compared to last March. Reaching $919/month, rent in Columbus, OH is $32 above last year’s average, while renting in Indianapolis, IN ($857/month) is $33 more expensive than a year ago.
Doug Ressler, Director of Business Intelligence at Yardi Matrix, sees the appeal large cities have for renters, despite rent increases. A majority of the robust cities are being driven by some combination of tourism, recreation, and the attraction of lifestyle amenities. However, each of these communities has developed a unique niche within these categories for their regions while staying focused on economic diversification, Ressler said. It has become critical for any metropolitan area today to capitalize on location advantages or other attributes, such as the presence of a research university or technical intelligence centers, in order to gain economic diversification growth.
| City | March 2019 | March 2018 | Percentage Change | Net Change |
|---|---|---|---|---|
| Manhattan (New York City), NY | $4,141 | $4,075 | 1.6% | $66 |
| Los Angeles, CA | $2,469 | $2,339 | 5.6% | $130 |
| Washington, D.C. | $2,135 | $2,086 | 2.3% | $49 |
| Seattle, WA | $2,058 | $2,004 | 2.7% | $54 |
| Chicago, IL | $1,900 | $1,830 | 3.8% | $70 |
| Denver, CO | $1,623 | $1,559 | 4.1% | $64 |
| Atlanta, GA | $1,424 | $1,372 | 3.8% | $52 |
| Orlando, FL | $1,402 | $1,350 | 3.9% | $52 |
| Austin, TX | $1,369 | $1,305 | 4.9% | $64 |
| Tampa, FL | $1,298 | $1,247 | 4.1% | $51 |
| Charlotte, NC | $1,189 | $1,155 | 2.9% | $34 |
| Dallas, TX | $1,202 | $1,157 | 3.9% | $45 |
| Houston, TX | $1,098 | $1,088 | 0.9% | $10 |
| Fort Worth, TX | $1,091 | $1,047 | 4.2% | $44 |
| Jacksonville, FL | $1,074 | $1,010 | 6.3% | $64 |
| Las Vegas, NV | $1,055 | $979 | 7.8% | $76 |
| San Antonio, TX | $1,021 | $985 | 3.7% | $36 |
| Phoenix, AZ | $1,037 | $962 | 7.8% | $75 |
| Columbus, OH | $919 | $887 | 3.6% | $32 |
| Indianapolis, IN | $857 | $824 | 4.0% | $33 |
Phoenix and Las Vegas rent hikes dominate among larger cities
Aggressive increases in the Southwest have kept Phoenix and Las Vegas at the top of the list when it comes to rent growth in the past year, 7.8%, which translates into $75 and $76 more per month, respectively. Apartments in Jacksonville, FL come in third with a 6.3% ($64) increase accounting for a monthly average rent of $1,074. LA, where the average rent price is $2,469 following a 5.6% increase that means $130 more per month. Apartments in Memphis, TN now go for $39 more than in March 2018: $790/month after a 5.2% increase. It’s important to note that, compared to this time last year, San Francisco, CA had the highest net increase among large cities – the average rent of $3,619 means new renters would have to pay $153 more than what they would’ve 12 months ago.
The weakest increases happened in Houston, TX(0.9%), followed by Manhattan and Portland, OR, both witnessing a 1.6% y-o-y increase. Rents in Queens reached $2,268 after a 1.8% y-o-y increase, and Boston, MA saw a 2% increase compared to last year, which brought the average rent price here to $3,343.

Rent growth in Mesa, AZ continues to outshine that of other mid-sized cities
Its proximity to Phoenix might contribute to why, with a 9.3% growth, the average monthly rent in Mesa, AZ of $1,009 has seen the sharpest year-over-year increase among mid-sized cities. At the same time, the city had the weakest month-over-month change, -0.2% (the same as Pittsburgh, PA, where the average rent is $1,209).
When it comes to mid-sized cities, Oakland, CA saw the second-fastest y-o-y increase at 6.7%, getting the average rent to $2,793/month. In Riverside, CA, apartment prices registered a 6.4% increase reaching $1,540. Two mid-sized cities in California and Arizona are in fourth and fifth place for highest annual increases: rent in Fresno, CA is $1,060, while in Tucson, AZ is $857 following 6.2% increases over the year.
See the complete list of cities at the end of this report

In the top mid-sized cities that had the slowest increases, year-over-year rent prices lag well below 3%. Apartments in Wichita, KS go for $645/month after a 1.9% y-o-y increase, followed by apartments in Lexington, KY, with an average of $899/month after a modest 2% increase. Kansas City, MO ($982) and Tulsa, OK ($687) saw the third-slowest yearly growth after both had a 2.1% rise in average rent prices compared to March 2018. Rent in Corpus Christi, TX averaged $973 with a 2.4% increase over the year.
The fastest and slowest rent increases registered in small U.S. cities
Except for Mesa, AZ, the fastest yearly rent increases happened in small cities. Midland, TX (14.6%) and Odessa, TX (13.3%) are the only cities in the country to see yearly increases of over 10%. As a result, the average rent in the two Texas cities reached $1,609 and $1,418, respectively. Compared to last March, renters in Midland pay an extra $205 for the average rent, whereas those in Odessa pay an extra $167 per month.
Chandler, AZ registered the third-fastest rent growth among small cities with 9.5%, meaning the average rent in the prominent Phoenix suburb reached $1,285 in March. Next up is Henderson, NV with an annual 9% increase accounting for its $1,264/month average, followed by Glendale, AZ where the 8.8% increase means that the average rent price is now $952.

Out of 253 cities, only seven saw yearly rent changes below 0% — and they are all small cities that include Pearland, TX (-2.3%), Santa Rosa, CA (-1.4%), Pembroke Pines, FL (also -1.4%), Edison, NJ (-1.1%), Baton Rouge, LA (-1%), College Station, TX (-0.7%), and Stamford, CT (-0.3%).
The top 10 most expensive and least expensive average rent prices in the U.S.
To no one’s surprise, Manhattan continues to have the most expensive average rent ($4,141), followed by San Francisco, CA ($3,619). The national Top 10 most expensive cities remained the same for March, which means Boston, MA maintains its third spot with a $3,343 average, followed by San Mateo, CA ($3,229) and Cambridge, MA ($3,052). Rent prices in the following cities (the rest of the Top 10) are all below $3,000/month: Jersey City, NJ; Sunnyvale, CA; Santa Clara, CA; Brooklyn, NY; Oakland, CA.
| City | State | Average rent |
|---|---|---|
| Manhattan | NY | $4,141 |
| San Francisco | CA | $3,619 |
| Boston | MA | $3,343 |
| San Mateo | CA | $3,229 |
| Cambridge | MA | $3,052 |
| Jersey City | NJ | $2,909 |
| Sunnyvale | CA | $2,903 |
| Santa Clara | CA | $2,863 |
| Brooklyn | NY | $2,860 |
| Oakland | CA | $2,793 |
| City | State | Average rent |
|---|---|---|
| Wichita | KS | $645 |
| Tulsa | OK | $687 |
| Brownsville | TX | $707 |
| Toledo | OH | $715 |
| Killeen | TX | $731 |
| Amarillo | TX | $731 |
| Independence | MO | $749 |
| Oklahoma City | OK | $755 |
| Fort Wayne | IN | $763 |
| Dayton | OH | $764 |
Check the average rent price in your city by using this interactive table:
| City | State | Average Rent | Change M-o-M | Change Y-o-Y |
|---|---|---|---|---|
| Wichita | KS | $645 | 0.2% | 1.9% |
| Lexington | KY | $899 | 0.0% | 2.0% |
| Brownsville | TX | $707 | 0.3% | 4.3% |
| Toledo | OH | $715 | 0.4% | 3.0% |
| Killeen | TX | $731 | 0.1% | 4.6% |
| Amarillo | TX | $731 | -0.3% | 0.6% |
| Independence | MO | $749 | 0.1% | 3.6% |
| Honolulu | HI | $1,728 | 7.7% | N/A |
| Fort Wayne | IN | $763 | 0.4% | 3.2% |
| Dayton | OH | $764 | 0.0% | 4.4% |
| Houston | TX | $1,098 | 0.3% | 0.9% |
| McAllen | TX | $773 | -0.4% | 0.7% |
| Little Rock | AR | $780 | 0.0% | 0.8% |
| Kansas City | KS | $781 | 0.3% | 2.1% |
| Manhattan | NY | $4,141 | 0.0% | 1.6% |
| Jackson | MS | $790 | 0.4% | 2.9% |
| Warren | MI | $801 | 0.1% | 3.2% |
| Las Cruces | NM | $801 | -1.0% | 0.4% |
| Mobile | AL | $813 | 0.5% | 4.5% |
| Augusta | GA | $817 | 0.9% | 3.4% |
| Broken Arrow | OK | $818 | 0.6% | 2.0% |
| Macon | GA | $823 | 0.2% | 3.7% |
| High Point | NC | $824 | 1.2% | 6.7% |
| Akron | OH | $828 | 0.2% | 1.3% |
| Lansing | MI | $841 | 0.0% | 2.3% |
| Winston-Salem | NC | $843 | 0.0% | 5.9% |
| Kansas City | MO | $982 | 0.3% | 2.1% |
| Portland | OR | $1,484 | 0.4% | 1.6% |
| Paradise | NV | $866 | 0.3% | 5.7% |
| Tulsa | OK | $687 | 0.3% | 2.1% |
| Columbus | GA | $869 | 0.7% | 3.5% |
| Pasadena | TX | $874 | 0.3% | 1.6% |
| Greensboro | NC | $880 | 0.5% | 4.3% |
| Norman | OK | $888 | 0.1% | 2.4% |
| Des Moines | IA | $896 | 0.3% | 1.6% |
| Corpus Christi | TX | $973 | 0.8% | 2.4% |
| Sterling Heights | MI | $910 | 0.3% | 2.9% |
| South Bend | IN | $910 | 0.3% | 1.9% |
| Minneapolis | MN | $1,557 | 0.5% | 2.8% |
| Queens | NY | $2,268 | 0.0% | 1.8% |
| Virginia Beach | VA | $1,178 | 0.2% | 2.9% |
| Metairie | LA | $926 | -0.1% | 3.5% |
| Lubbock | TX | $930 | 0.2% | 2.3% |
| Olathe | KS | $933 | 0.3% | 1.1% |
| Boston | MA | $3,343 | 0.5% | 2.0% |
| Newport News | VA | $943 | -0.1% | 3.3% |
| Waterbury | CT | $946 | 0.6% | 1.1% |
| Glendale | AZ | $952 | -0.1% | 8.8% |
| Mesquite | TX | $959 | -0.6% | 1.2% |
| Lincoln | NE | $962 | 0.3% | 5.4% |
| Birmingham | AL | $963 | 0.2% | 3.8% |
| Waco | TX | $968 | 0.0% | 0.7% |
| Milwaukee | WI | $1,160 | 0.2% | 3.0% |
| Cincinnati | OH | $975 | 0.3% | 3.1% |
| Aurora | CO | $1,326 | 0.1% | 3.4% |
| Spokane | WA | $989 | 0.8% | 8.3% |
| Chattanooga | TN | $992 | 0.6% | 7.1% |
| Arlington | TX | $1,012 | 0.0% | 3.5% |
| St. Louis | MO | $923 | 0.1% | 3.6% |
| Albuquerque | NM | $868 | -0.1% | 3.7% |
| Baltimore | MD | $1,260 | 0.6% | 2.3% |
| Baton Rouge | LA | $1,025 | -0.2% | -1.0% |
| Knoxville | TN | $1,028 | 0.4% | 3.7% |
| Grand Rapids | MI | $1,029 | 0.2% | 5.8% |
| Rochester | NY | $1,030 | 0.7% | 3.6% |
| Hampton | VA | $1,031 | 0.1% | 3.8% |
| Salem | OR | $1,032 | 0.7% | 6.2% |
| Washington | DC | $2,135 | 0.1% | 2.3% |
| Garland | TX | $1,038 | 0.2% | 5.7% |
| North Charleston | SC | $1,043 | 1.5% | 6.3% |
| Columbia | SC | $1,048 | 0.4% | 4.5% |
| Savannah | GA | $1,050 | 0.1% | 2.7% |
| North Las Vegas | NV | $1,053 | 0.3% | 6.6% |
| Buffalo | NY | $1,053 | -0.6% | 1.1% |
| Seattle | WA | $2,058 | 0.4% | 2.7% |
| Anaheim | CA | $1,792 | 0.3% | 3.7% |
| Lakeland | FL | $1,060 | 1.2% | 5.9% |
| San Jose | CA | $2,717 | 0.4% | 2.8% |
| Norfolk | VA | $1,073 | 0.1% | 3.2% |
| Charlotte | NC | $1,189 | -0.1% | 2.9% |
| Omaha | NE | $913 | 1.0% | 3.8% |
| Richmond | VA | $1,082 | 0.0% | 4.8% |
| Overland Park | KS | $1,084 | 0.2% | 3.3% |
| Victorville | CA | $1,089 | 0.3% | 5.0% |
| Grand Prairie | TX | $1,090 | 0.0% | 5.5% |
| Oklahoma City | OK | $755 | 0.1% | 3.0% |
| Clovis | CA | $1,097 | 0.2% | 5.0% |
| Brooklyn | NY | $2,860 | 0.0% | 3.2% |
| West Valley City | UT | $1,116 | 0.1% | 3.6% |
| Syracuse | NY | $1,117 | 0.6% | 2.4% |
| Murfreesboro | TN | $1,122 | 0.7% | 4.6% |
| Boise | ID | $1,127 | -0.2% | 7.8% |
| Atlanta | GA | $1,424 | -0.1% | 3.8% |
| Durham | NC | $1,137 | 0.4% | 5.1% |
| Wilmington | NC | $1,142 | -0.7% | 7.3% |
| Santa Ana | CA | $1,931 | 0.5% | 3.9% |
| Miami | FL | $1,702 | 0.4% | 3.9% |
| Lewisville | TX | $1,145 | -0.3% | 1.9% |
| Irving | TX | $1,146 | 0.0% | 3.3% |
| West Jordan | UT | $1,148 | 0.3% | 4.7% |
| Peoria | AZ | $1,149 | -0.6% | 7.0% |
| Round Rock | TX | $1,159 | 0.0% | 4.2% |
| Tampa | FL | $1,298 | 0.1% | 4.1% |
| Newark | NJ | $1,171 | -0.3% | 1.0% |
| Colorado Springs | CO | $1,128 | 0.5% | 4.2% |
| New Orleans | LA | $1,145 | 0.2% | 4.2% |
| Greeley | CO | $1,180 | 1.1% | 8.5% |
| Brandon | FL | $1,180 | 0.1% | 2.9% |
| Clearwater | FL | $1,185 | 0.2% | 4.5% |
| Hartford | CT | $1,186 | 0.3% | 0.3% |
| El Paso | TX | $769 | -0.1% | 3.5% |
| Carrollton | TX | $1,190 | 0.1% | 2.8% |
| Cary | NC | $1,194 | 0.3% | 5.2% |
| Salt Lake City | UT | $1,196 | 0.2% | 6.6% |
| Denton | TX | $1,200 | -0.2% | 2.8% |
| Columbus | OH | $919 | -0.2% | 3.6% |
| College Station | TX | $1,204 | 0.1% | -0.7% |
| Modesto | CA | $1,205 | 0.0% | 4.2% |
| Raleigh | NC | $1,172 | 0.7% | 4.5% |
| Chesapeake | VA | $1,209 | 0.2% | 3.7% |
| Elizabeth | NJ | $1,220 | -1.2% | 0.8% |
| Tallahassee | FL | $1,223 | 0.7% | 2.5% |
| San Bernardino | CA | $1,233 | 0.2% | 6.8% |
| Madison | WI | $1,239 | 0.4% | 2.7% |
| Gilbert | AZ | $1,240 | 0.0% | 7.4% |
| Reno | NV | $1,243 | 0.6% | 7.6% |
| McKinney | TX | $1,244 | -0.4% | 2.3% |
| Louisville | KY | $941 | 0.3% | 3.6% |
| Gainesville | FL | $1,262 | 0.2% | 6.4% |
| Henderson | NV | $1,264 | 0.2% | 9.0% |
| St. Paul | MN | $1,265 | 0.4% | 3.6% |
| Lancaster | CA | $1,273 | 0.3% | 3.6% |
| Tacoma | WA | $1,280 | -0.3% | 5.5% |
| Pearland | TX | $1,280 | 0.2% | -2.3% |
| Plano | TX | $1,281 | 0.2% | 1.9% |
| Chandler | AZ | $1,285 | -0.2% | 9.5% |
| St. Petersburg | FL | $1,285 | 0.2% | 3.3% |
| Rialto | CA | $1,286 | 0.4% | 6.2% |
| Gresham | OR | $1,286 | 0.5% | 6.0% |
| Fontana | CA | $1,292 | 0.2% | 4.3% |
| Vancouver | WA | $1,296 | 0.6% | 3.5% |
| Stockton | CA | $1,145 | 0.1% | 4.8% |
| Aurora | IL | $1,312 | 0.4% | 3.5% |
| Charleston | SC | $1,312 | 0.9% | 2.0% |
| Eugene | OR | $1,317 | 0.3% | 4.9% |
| Pittsburgh | PA | $1,209 | -0.2% | 4.8% |
| Tempe | AZ | $1,335 | 0.0% | 5.4% |
| Frisco | TX | $1,342 | 0.1% | 1.4% |
| Manchester | NH | $1,346 | 0.4% | 6.0% |
| San Antonio | TX | $1,021 | 0.3% | 3.7% |
| Richardson | TX | $1,351 | 0.9% | 4.6% |
| Chicago | IL | $1,900 | 0.1% | 3.8% |
| Cleveland | OH | $1,078 | 0.1% | 5.3% |
| Hialeah | FL | $1,375 | 0.9% | 4.5% |
| Pompano Beach | FL | $1,392 | -0.3% | 4.5% |
| Orlando | FL | $1,402 | -0.1% | 3.9% |
| Everett | WA | $1,405 | 0.4% | 3.5% |
| Odessa | TX | $1,418 | 2.5% | 13.3% |
| Thornton | CO | $1,421 | 0.0% | 6.0% |
| Arvada | CO | $1,422 | 0.5% | 7.1% |
| Sacramento | CA | $1,371 | 0.1% | 5.4% |
| Naperville | IL | $1,427 | -0.2% | 0.1% |
| Sandy Springs | GA | $1,441 | 0.1% | 1.9% |
| West Palm Beach | FL | $1,455 | 1.5% | 5.5% |
| Westminster | CO | $1,457 | 0.8% | 4.1% |
| Kent | WA | $1,459 | 0.7% | 2.2% |
| Scottsdale | AZ | $1,469 | -0.2% | 7.9% |
| Hillsboro | OR | $1,473 | 0.5% | 0.7% |
| Moreno Valley | CA | $1,475 | 1.7% | 5.0% |
| Lakewood | CO | $1,475 | 0.5% | 2.9% |
| Dallas | TX | $1,202 | 0.1% | 3.9% |
| Hollywood | FL | $1,488 | 0.1% | 4.2% |
| Ann Arbor | MI | $1,508 | -0.5% | 2.5% |
| Fort Collins | CO | $1,510 | 0.2% | 1.1% |
| El Cajon | CA | $1,535 | 0.3% | 5.3% |
| Bakersfield | CA | $993 | 0.1% | 5.8% |
| Edison | NJ | $1,546 | 0.8% | -1.1% |
| Long Beach | CA | $2,004 | -0.1% | 5.9% |
| Pomona | CA | $1,564 | 2.0% | 7.7% |
| San Diego | CA | $2,155 | 0.0% | 3.9% |
| Escondido | CA | $1,600 | -0.2% | 3.8% |
| Midland | TX | $1,609 | 0.6% | 14.6% |
| Santa Maria | CA | $1,609 | -1.3% | 6.4% |
| Indianapolis | IN | $857 | 0.0% | 4.0% |
| Murrieta | CA | $1,629 | 0.9% | 3.0% |
| Temecula | CA | $1,656 | 0.0% | 5.3% |
| Renton | WA | $1,660 | 0.8% | 3.4% |
| Roseville | CA | $1,665 | -0.1% | 6.1% |
| Salinas | CA | $1,680 | 0.5% | 3.7% |
| New Haven | CT | $1,685 | 0.4% | 4.0% |
| Corona | CA | $1,689 | 0.2% | 2.1% |
| Coral Springs | FL | $1,691 | -0.2% | 1.3% |
| Tucson | AZ | $857 | 0.1% | 6.2% |
| Pembroke Pines | FL | $1,707 | -0.5% | -1.4% |
| Alexandria | VA | $1,709 | 0.2% | 3.0% |
| Ontario | CA | $1,727 | 0.3% | 3.1% |
| Denver | CO | $1,623 | 0.3% | 4.1% |
| Chula Vista | CA | $1,729 | 0.0% | 3.8% |
| Davie | FL | $1,740 | 0.1% | 1.3% |
| Vallejo | CA | $1,757 | 0.2% | 3.2% |
| Garden Grove | CA | $1,760 | 0.5% | 5.3% |
| Vista | CA | $1,763 | 0.4% | 3.4% |
| Fairfield | CA | $1,773 | 0.5% | 4.9% |
| Fresno | CA | $1,060 | 0.1% | 6.2% |
| Oceanside | CA | $1,801 | 0.1% | 4.8% |
| West Covina | CA | $1,809 | 0.2% | 4.0% |
| Miramar | FL | $1,841 | 0.5% | 2.2% |
| Rancho Cucamonga | CA | $1,866 | 0.2% | 4.6% |
| Fullerton | CA | $1,895 | 0.7% | 4.5% |
| Fort Worth | TX | $1,091 | 0.3% | 4.2% |
| Fort Lauderdale | FL | $1,902 | 0.4% | 1.0% |
| Oxnard | CA | $1,914 | 0.2% | 4.5% |
| Santa Rosa | CA | $1,919 | 0.1% | -1.4% |
| Riverside | CA | $1,540 | 0.1% | 6.4% |
| Torrance | CA | $1,937 | 0.1% | 6.3% |
| Santa Clarita | CA | $1,941 | 0.3% | 2.3% |
| Boulder | CO | $1,950 | 0.8% | 5.0% |
| Ventura | CA | $1,950 | 0.3% | 3.0% |
| Concord | CA | $1,955 | 0.4% | 4.1% |
| Simi Valley | CA | $1,955 | 0.0% | 4.0% |
| Oakland | CA | $2,793 | 1.6% | 6.7% |
| Yonkers | NY | $2,015 | -0.4% | 5.7% |
| Orange | CA | $2,019 | 0.5% | 2.1% |
| San Francisco | CA | $3,619 | 0.2% | 4.4% |
| Costa Mesa | CA | $2,075 | 0.3% | 3.6% |
| Hayward | CA | $2,104 | 0.1% | 3.2% |
| Philadelphia | PA | $1,600 | 0.5% | 4.6% |
| Thousand Oaks | CA | $2,137 | 0.2% | 5.9% |
| Arlington | VA | $2,153 | 0.2% | 3.6% |
| Huntington Beach | CA | $2,155 | 0.4% | 8.0% |
| Austin | TX | $1,369 | 0.0% | 4.9% |
| Bellevue | WA | $2,205 | 0.7% | 4.2% |
| Burbank | CA | $2,242 | 0.1% | 5.1% |
| Nashville | TN | $1,347 | 0.7% | 4.9% |
| Carlsbad | CA | $2,275 | 0.0% | 3.3% |
| Stamford | CT | $2,344 | -0.3% | -0.3% |
| Irvine | CA | $2,394 | 0.6% | 1.6% |
| Fremont | CA | $2,417 | 0.5% | 3.3% |
| Detroit | MI | $1,062 | 0.0% | 4.9% |
| Daly City | CA | $2,510 | 0.8% | 4.1% |
| Glendale | CA | $2,525 | 0.2% | 5.3% |
| Pasadena | CA | $2,527 | 0.4% | 4.5% |
| Memphis | TN | $790 | 0.3% | 5.2% |
| Mesa | AZ | $1,007 | -0.2% | 9.3% |
| Los Angeles | CA | $2,469 | 0.0% | 5.6% |
| Santa Clara | CA | $2,863 | 0.4% | 2.9% |
| Sunnyvale | CA | $2,903 | 0.4% | 3.6% |
| Jersey City | NJ | $2,909 | -0.5% | 2.4% |
| Cambridge | MA | $3,052 | 0.3% | 1.0% |
| San Mateo | CA | $3,229 | 0.5% | 2.8% |
| Jacksonville | FL | $1,074 | 0.8% | 6.3% |
| Las Vegas | NV | $1,055 | 0.5% | 7.8% |
| Phoenix | AZ | $1,037 | 0.0% | 7.8% |
[mailmunch-form id=”583374″]
Methodology:
RentCafe is a nationwide apartment search website that enables renters to easily find apartments and houses for rent throughout the United States.
To compile this report, RentCafe’s research team analyzed rent data across the 253 largest cities in the US. The report is exclusively based on apartment data related to buildings containing 50 or more units. Our report includes cities with populations over 100,000 and a rental stock of at least 2,900 apartments in 50+ unit buildings.
In this report, large cities are cities with a population of 600,000 people or more, mid-sized cities are cities with a population between 300,000 and 600,000, and small cities are cities with a population of less than 300,000.
Rent data was provided by Yardi Matrix, a business development and asset management tool for brokers, sponsors, banks and equity sources underwriting investments in the multifamily, office, industrial and self-storage sectors. Rental rate coverage is for Market Rate properties only. Fully Affordable properties are not included in the Yardi Matrix rental surveys and are not reported in rental rate averages.
Starting with the January 2017 rent survey, Yardi Matrix is using a methodology that incorporates more properties into the sample which caused slight changes in overall rents and year-over-year changes compared to the previous reports. We expect this methodology adjustment to produce more accurate averages at the national and metro levels.
*National averages include over 130 markets across the U.S., as reported by Yardi Matrix.
Fair use and redistribution
We encourage you and freely grant you permission to reuse, host, or repost the images in this article. When doing so, we only ask that you kindly attribute the authors by linking to RentCafe.com or this page, so that your readers can learn more about this project, the research behind it and its methodology.For more in-depth, customized data, please contact us at media@rentcafe.com.
Share this article:

Alexandra Ciuntu
Alexandra is a creative writer and researcher for RentCafe. With a background in e-learning content writing and a passion for knowledge-sharing platforms, she's covered topics from prop-tech to renters insurance to interior design tips. Very familiar with the renter lifestyle herself, Alexandra enjoys researching and writing about renter demographic shifts and residential real estate market trends as much as she loves writing about how to get along with roommates. You can connect with Alexandra via email.
Alexandra’s work includes collaborations with financial and business publications. Her articles have been featured in several national and international online publications, including the New York Times, Barrons, Inman, Forbes, Architectural Digest, Marketwatch, Bisnow, and Curbed. Her educational background includes a B.A. in Japanese and English and an M.A. in Journalism and Cultural Studies.
Sign up for The Ready Renter newsletter
Get our free apartment hunting guide — plus tips, trends, and research.
")

")

Related posts

Green flags vs. red flags: what to notice on every apartment tour
Finding a place online is the easy part. The apartment tour is where you find out what the photos left out. For a first-time renter,…

Renting like a local: 5 questions to ask before signing a lease in Boston
Boston is one of the most rewarding cities to call home. It’s walkable, full of history and packed with distinct neighborhoods that each have their…

Here’s how to get around Pittsburgh as a renter using public transit
Pittsburgh is a city of three rivers, steep ridges and nearly 450 bridges. All that terrain shapes how you get from your front door to…
Subscribe to
The Ready Renter newsletter


