February Rents Increased the Most in Small Markets; Colorado Among the Most Active
Share this article:
Key takeaways:
- The national average rent was $1,364 in February 2018, 2.7 percent higher than this time last year, and up 0.01 percent ($1) month over month, according to data from Yardi Matrix.
- 87 percent of the nation’s biggest 250 cities have seen rents grow in February year over year, in 11 percent of cities rents remained unchanged, while only 2 percent experienced rent drops compared to 2017.
- 19 of the top 20 fastest growing rents are in small cities, led by Odessa, TX, up by almost 40% year over year, and Midland, TX, up by more than 35% year over year.
- Among the largest U.S. cities, Las Vegas, Denver, and Detroit had the fastest rising prices in February, while New York City, El Paso, and Austin the slowest.

Studio apartment rents are the slowest growing by apartment size
The cost of renting 1, 2 and 3-bedroom units increased by 3.2% year over year, and by 0.2% month over month, outpacing rents for studio apartments, which were up by 2.0% y-o-y and stagnant for the month. The average price of a studio apartment in the U.S. in February was $1,258, and the national average price of a 3-bedroom apartment was $1,649.
| Bedroom Type | Average Rent | Change M-o-M | Change Y-o-Y |
|---|---|---|---|
| Studio | $1,258 | 0.0% | 2.0% |
| 1 Bed | $1,228 | 0.2% | 3.2% |
| 2 Beds | $1,410 | 0.2% | 3.2% |
| 3 Beds | $1,649 | 0.2% | 3.2% |
Nationally, four newcomers climb to the top 10 U.S. cities with fastest-rising rents

The national average rent in February was 2.7% higher than the same time last year, reaching $1,364/month. Odessa, TX leads the country with the most spectacular rent increase over the year, 38.9%, topping $1,200/month, compared to $864/month in February last year. Rents in Midland, TX are the second fastest rising in the nation, 35.7% higher than in February last year, reaching $1,360/month. The remarkable price rebounds taking place in these two cities are tightly connected to the ups and downs of their oil-centered economies.
Renters in Lancaster, CA and Reno, NV (the third and fourth fastest growing rental markets in the U.S.) were also seeing double-digit price increases in February, 11.1% and 10.3% respectively. The average price of an apartment in Lancaster, CA is now $1,210, while in Reno, NV the average apartment costs $1,132 per month.
Two Colorado cities are new in the top 10 cities with fastest rising rents in the nation: Fort Collins, posting a 9.9% y-o-y increase, and neighboring Greeley, with a 9.0% y-o-y increase. Apartments in Fort Collins rent for $1,468/month on average, and those in Greeley for $1,080/month on average. Rental prices in North Las Vegas are fast-approaching $1,000/month, on average. In terms of rate of increase, they jumped from 20th place in January to 9th place in February, with an annual increase of 8.7%. Yonkers, NY is re-entering the top 10 thanks to a 9.0% price increase in February. Renters in Yonkers now pay $1,909/month, on average. Renting an apartment in Salinas, CA is now 9% more expensive than this time last year, pushing Salinas up 4 spots to no. 6 for fastest growing rents in the country ($1,605/month on average).
The slowest rental markets in February in the U.S. were Lubbock, TX (where rents decreased by -4.8% y-o-y), Norman, OK (rents down -2.7%) and Baton Rouge, LA (rents down -2.1%). Apartment rents in College Station, TX were also decreasing over the year by -1.2%. Pricey Stamford, CT saw rents slightly down in February, by -1.1% year-over-year, with an average rent of $2,331/month.
Large cities: Las Vegas boasts the fastest increasing rents, followed by Denver

The average rent in Las Vegas is fast approaching $1,000/month (currently $969), posting the highest year-over-year increase among the nation’s largest cities: 6.6%. Rental prices have been rapidly increasing in Vegas for more than a year now, thanks to a rebound in home prices which is boosting the demand for rentals. Denver, CO, one of the hottest large rental markets in the country, has climbed to the second spot this month for fastest-rising rental prices, up 5.8% year over year. The monthly average price of an apartment in Denver as of February 2018 was $1,536, $84/month more than in February last year. Renters in Detroit, MI, Phoenix, AZ, and Jacksonville, FL are also paying over 5% more in rent than they did one year ago.
Rents continue to decline in two New York City boroughs: Brooklyn, NY (down by -0.7% y-o-y) and Manhattan, NY (down by -0.2% y-o-y), the slowest large markets in the country as of February 2018. Rents are also cooling in El Paso, TX, Austin, TX, and Portland, OR, growing by less than 1% year over year, finding some balance after a fairly large influx of new apartments came online in the last 3 to 4 years.
Mid-size cities: Colorado Springs and Stockton, CA challenge Sacramento with rising rents
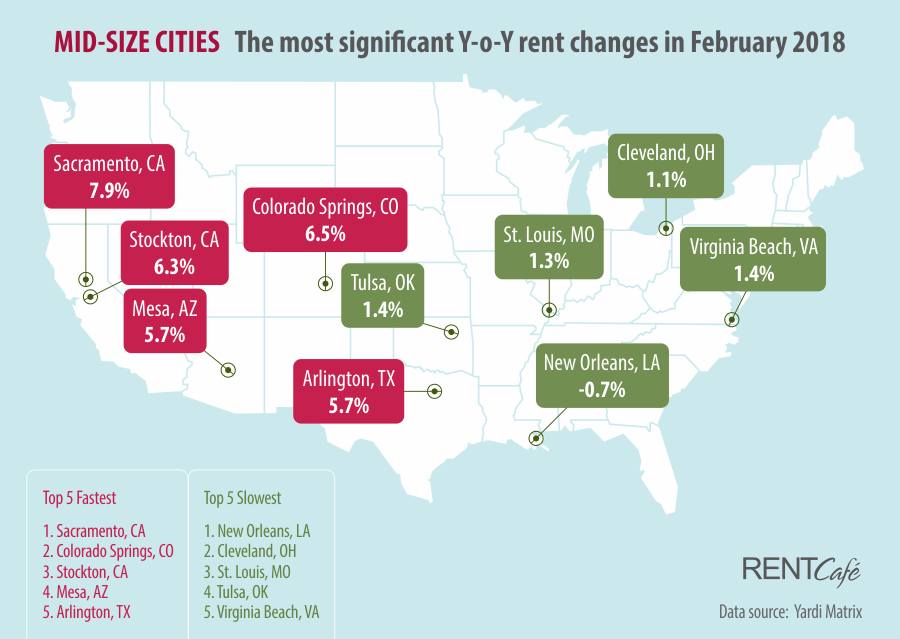
Mid-size cities see mid-sized increases compared to other markets. Among them, Sacramento, Colorado Springs, Stockton, CA, Mesa, AZ, and Arlington, TX posted the biggest year over year rent increases in February. Rent prices in Sacramento continue to rise faster than in any other city of similar size, hitting $1,292/month in February, up by 7.9% year over year and almost $100 more per month than one year ago. Colorado Springs rentals are now 6.5% more expensive than in February last year, with the average price of an apartment at $1,071/month, helping Colorado secure a spot among the hottest housing markets in the nation.
New Orleans is the only mid-size city to see a decline in rent prices this February, if only a small one (-0.7%), currently at $1,092/month. Rents in Cleveland aren’t changing much either, up just 1.1% for the year, clocking in at exactly $1,000/month as of February 2018. Likewise, small rent increases were seen in St. Louis, MO, Virginia Beach, VA, and Tulsa, OK. Other slow-growing markets in the mid-size category are Raleigh, NC, Wichita, KS, Lexington, KY, Pittsburgh, PA and Miami, FL, all below 2%.
Small cities claim 19 of the top 20 largest rent increases in the U.S. in February

With the exception of Sacramento, all the other names in the top 20 for highest rent increases in February are small-sized cities. Outliers Odessa and Midland, TX are the long-time leaders, with spectacular year over year rent increases of 38.9% and 35.7% respectively. The unusual increases in Midland-Odessa reflect rebounding housing prices after they were highly affected by a big drop in oil prices about two years ago.
Lancaster, CA apartments in L.A. County are getting more expensive, with prices shooting up 11.1% since the same time last year, suffering the third largest increase in the U.S. Reno, NV has been in the spotlight for its skyrocketing rents for a few months now. The city posted a 10.3% jump in prices in February increasing by more than $100/month compared to last February. The fifth largest rent increase in a small city was in Fort Collins in Colorado, where prices inflated by almost 10% over the year, nearing the $1,500/month mark. Salinas, CA, Yonkers, NY, Greeley, CO and North Las Vegas also posted rent increases above 8%. Notable in 11th and 12th place are emerging markets Orlando, FL with a hefty 7.8% y-o-y increase in rents, and Tacoma, WA, with a 7.7% y-o-y increase.
Colorado, Nevada, and Arizona on the watchlist of fastest growing markets
Many of the cities where renters are seeing the fastest growing rents are in Colorado, Nevada, or Arizona. Colorado is a recurring presence in the top 5 fastest-rising rents in every market size category. In total, seven Colorado cities saw rents increase by more than 5% over the year: Fort Collins (9.9%), Greeley (9%), Arvada (7.6%), Colorado Springs (6.5%), Boulder (6.3%), Denver (5.8%), and Aurora (5.2%). Nevada‘s rejuvenated housing markets Las Vegas (6.6%), North Las Vegas (8.7%), and Reno (10.3%) have also been very visible on the national rental scene lately with some of the fastest-rising rental prices in the U.S. Increasingly popular Arizona has five cities where rent prices increased by more than 5% in the last year: Peoria (6.9%), Gilbert (6.8%), Mesa (5.7%), Phoenix (5.4%), and Chandler (5.3%).
Doug Ressler, Yardi Matrix senior analyst, talks about some of the factors causing rent fluctuations in certain markets:
Population migration is occurring to affordable Southern and Southwestern states where economic growth is outpacing Northern regions. A recent study by RedFin shows that people are leaving high-tax coastal markets like San Francisco, New York, and Los Angeles in search of homes in more affordable metros with lower taxes like Sacramento, Phoenix, Las Vegas and Nashville.
Curious about rents in cities like Los Angeles, San Francisco, Cincinnati, Raleigh, or Charlotte? Check out the average price of rent in your city by using this interactive table:
| City | State | Average Rent | Change M-o-M | Change Y-o-Y |
|---|---|---|---|---|
| Manhattan (New York City) | NY | $4,063 | -0.10% | -0.20% |
| San Francisco | CA | $3,428 | -0.10% | 2.00% |
| Boston | MA | $3,221 | -0.20% | 1.50% |
| San Mateo | CA | $3,136 | 2.00% | 4.60% |
| Cambridge | MA | $2,996 | -0.20% | 1.50% |
| Jersey City | NJ | $2,826 | -0.20% | 0.70% |
| Sunnyvale | CA | $2,761 | 0.70% | 4.10% |
| Santa Clara | CA | $2,727 | 0.70% | 3.50% |
| Brooklyn (New York City) | NY | $2,686 | -0.20% | -0.70% |
| San Jose | CA | $2,630 | 0.50% | 3.30% |
| Oakland | CA | $2,519 | -0.70% | 2.60% |
| Daly City | CA | $2,510 | 0.60% | 3.80% |
| Glendale | CA | $2,406 | 0.10% | 2.50% |
| Pasadena | CA | $2,379 | 0.00% | 2.90% |
| Irvine | CA | $2,362 | -0.60% | 2.40% |
| Stamford | CT | $2,331 | -0.60% | -1.10% |
| Fremont | CA | $2,307 | -0.20% | 2.00% |
| Los Angeles | CA | $2,303 | 0.10% | 4.00% |
| Carlsbad | CA | $2,179 | -0.50% | 4.80% |
| Burbank | CA | $2,125 | -2.00% | 3.50% |
| Bellevue | WA | $2,081 | 0.90% | 0.70% |
| Washington | DC | $2,066 | -0.70% | 1.40% |
| San Diego | CA | $2,049 | 0.20% | 5.00% |
| Arlington | VA | $2,049 | -0.40% | -1.00% |
| Hayward | CA | $2,028 | 0.00% | 3.00% |
| Thousand Oaks | CA | $2,016 | 0.10% | 1.90% |
| Costa Mesa | CA | $2,001 | -0.10% | 3.30% |
| Huntington Beach | CA | $1,999 | 0.00% | 3.50% |
| Orange | CA | $1,977 | 0.50% | 3.80% |
| Seattle | WA | $1,968 | 0.10% | 3.90% |
| Yonkers | NY | $1,909 | 0.30% | 9.00% |
| Santa Rosa | CA | $1,892 | 0.40% | 6.80% |
| Ventura | CA | $1,880 | 0.10% | 5.30% |
| Long Beach | CA | $1,877 | 0.00% | 3.80% |
| Santa Clarita | CA | $1,866 | 2.00% | 6.20% |
| Concord | CA | $1,866 | -0.50% | 1.50% |
| Simi Valley | CA | $1,863 | -1.10% | 3.70% |
| Fort Lauderdale | FL | $1,850 | 0.40% | 5.30% |
| Santa Ana | CA | $1,850 | 0.20% | 4.00% |
| Boulder | CO | $1,834 | -0.70% | 6.30% |
| Oxnard | CA | $1,820 | -0.30% | 2.90% |
| Torrance | CA | $1,813 | 0.40% | 6.60% |
| Miramar | FL | $1,807 | 1.60% | 3.90% |
| Fullerton | CA | $1,804 | 0.00% | 2.80% |
| Chicago | IL | $1,801 | 0.60% | 2.50% |
| Rancho Cucamonga | CA | $1,767 | 0.50% | 4.30% |
| Anaheim | CA | $1,735 | -0.10% | 4.30% |
| West Covina | CA | $1,733 | 0.50% | 5.80% |
| Oceanside | CA | $1,706 | 0.20% | 5.10% |
| Vista | CA | $1,705 | -0.30% | 4.80% |
| Davie | FL | $1,703 | 2.10% | 3.70% |
| Vallejo | CA | $1,685 | -0.50% | 4.90% |
| Fairfield | CA | $1,679 | -0.40% | 6.90% |
| Garden Grove | CA | $1,661 | 0.40% | 3.70% |
| Pembroke Pines | FL | $1,660 | 2.30% | 1.90% |
| Coral Springs | FL | $1,654 | -0.20% | 0.60% |
| Chula Vista | CA | $1,652 | 0.30% | 5.00% |
| Alexandria | VA | $1,646 | 0.10% | -0.10% |
| New Haven | CT | $1,630 | 0.10% | 5.00% |
| Corona | CA | $1,628 | 0.60% | 5.90% |
| Miami | FL | $1,608 | -0.10% | 2.00% |
| Salinas | CA | $1,605 | 1.50% | 9.00% |
| Ontario | CA | $1,592 | 0.30% | 2.80% |
| Murrieta | CA | $1,576 | -0.50% | 3.50% |
| Temecula | CA | $1,572 | -0.10% | 4.00% |
| Renton | WA | $1,570 | 0.00% | 4.30% |
| Edison | NJ | $1,555 | -0.50% | 3.50% |
| Roseville | CA | $1,552 | -1.00% | 4.70% |
| Denver | CO | $1,536 | 0.70% | 5.80% |
| Escondido | CA | $1,530 | 0.00% | 6.30% |
| Philadelphia | PA | $1,516 | 0.30% | 3.10% |
| Santa Maria | CA | $1,506 | -0.30% | 2.40% |
| Minneapolis | MN | $1,503 | 0.80% | 3.70% |
| Ann Arbor | MI | $1,471 | 0.00% | 4.90% |
| Fort Collins | CO | $1,468 | 2.30% | 9.90% |
| El Cajon | CA | $1,450 | 0.70% | 5.20% |
| Hillsboro | OR | $1,447 | 0.60% | -0.30% |
| Portland | OR | $1,446 | 0.30% | 0.80% |
| Riverside | CA | $1,434 | -0.10% | 4.40% |
| Pomona | CA | $1,426 | 0.60% | 0.40% |
| Naperville | IL | $1,423 | 0.00% | 1.20% |
| Sandy Springs | GA | $1,422 | 2.40% | 4.30% |
| Lakewood | CO | $1,420 | 0.40% | 4.30% |
| Kent | WA | $1,413 | 0.90% | 7.10% |
| Moreno Valley | CA | $1,385 | 0.30% | 4.90% |
| West Palm Beach | FL | $1,378 | 0.50% | 6.10% |
| Westminster | CO | $1,374 | 0.40% | 4.20% |
| Midland | TX | $1,360 | 3.30% | 35.70% |
| Atlanta | GA | $1,355 | 0.30% | 3.20% |
| Scottsdale | AZ | $1,350 | 0.60% | 4.80% |
| Everett | WA | $1,336 | -0.20% | 3.40% |
| Thornton | CO | $1,335 | -0.40% | 3.20% |
| Orlando | FL | $1,332 | 0.60% | 7.80% |
| Hollywood | FL | $1,332 | 1.30% | 3.30% |
| Arvada | CO | $1,323 | -0.10% | 7.60% |
| Pompano Beach | FL | $1,321 | -0.80% | 1.90% |
| Frisco | TX | $1,312 | -0.50% | 1.80% |
| Pearland | TX | $1,303 | 0.60% | 2.00% |
| Sacramento | CA | $1,292 | 0.20% | 7.90% |
| Austin | TX | $1,292 | -0.30% | 0.70% |
| Richardson | TX | $1,289 | -0.40% | -0.50% |
| Aurora | CO | $1,272 | -0.20% | 5.20% |
| Nashville | TN | $1,270 | 0.10% | 1.10% |
| Hialeah | FL | $1,267 | 0.50% | 3.50% |
| Aurora | IL | $1,267 | 0.10% | 1.40% |
| Manchester | NH | $1,259 | 0.60% | 2.80% |
| Tempe | AZ | $1,257 | 0.90% | 4.90% |
| Eugene | OR | $1,250 | -0.50% | 4.30% |
| Plano | TX | $1,249 | -0.20% | 1.90% |
| Vancouver | WA | $1,247 | 0.40% | 4.80% |
| St. Petersburg | FL | $1,246 | -0.50% | 7.10% |
| Charleston | SC | $1,246 | 0.50% | 0.50% |
| Tampa | FL | $1,236 | 0.50% | 5.20% |
| Fontana | CA | $1,235 | 0.50% | 6.40% |
| Baltimore | MD | $1,223 | -0.20% | 2.30% |
| Lancaster | CA | $1,210 | 1.20% | 11.10% |
| Gresham | OR | $1,207 | -0.20% | 2.70% |
| Elizabeth | NJ | $1,205 | 0.70% | 7.80% |
| McKinney | TX | $1,205 | -0.50% | 1.30% |
| Tacoma | WA | $1,203 | 0.30% | 7.70% |
| Madison | WI | $1,203 | 0.70% | 1.30% |
| College Station | TX | $1,203 | 0.00% | -1.20% |
| Rialto | CA | $1,201 | 0.00% | 5.30% |
| Odessa | TX | $1,200 | 2.60% | 38.90% |
| Gainesville | FL | $1,182 | 1.00% | 5.40% |
| Hartford | CT | $1,177 | -0.30% | 0.10% |
| Tallahassee | FL | $1,174 | 0.90% | 3.70% |
| Denton | TX | $1,163 | 0.10% | 3.70% |
| Chesapeake | VA | $1,160 | -0.50% | 1.70% |
| Chandler | AZ | $1,157 | -0.40% | 5.30% |
| Modesto | CA | $1,154 | -0.40% | 7.10% |
| Newark | NJ | $1,154 | 0.10% | 2.30% |
| Henderson | NV | $1,149 | 0.00% | 5.30% |
| Dallas | TX | $1,146 | 0.00% | 3.60% |
| Carrollton | TX | $1,146 | 0.40% | 2.30% |
| Gilbert | AZ | $1,145 | -0.50% | 6.80% |
| Pittsburgh | PA | $1,143 | 0.00% | 1.80% |
| Brandon | FL | $1,142 | 0.20% | 5.60% |
| Charlotte | NC | $1,138 | 0.30% | 3.40% |
| Virginia Beach | VA | $1,137 | -0.90% | 1.40% |
| Reno | NV | $1,132 | 0.80% | 10.30% |
| San Bernardino | CA | $1,132 | 0.10% | 5.40% |
| Clearwater | FL | $1,126 | 0.40% | 4.30% |
| Cary | NC | $1,124 | 0.40% | 1.70% |
| Milwaukee | WI | $1,115 | -0.20% | 2.30% |
| Salt Lake City | UT | $1,110 | -0.20% | 4.20% |
| Raleigh | NC | $1,106 | -0.20% | 1.50% |
| Round Rock | TX | $1,103 | -0.50% | 1.70% |
| Irving | TX | $1,102 | -0.10% | 3.60% |
| Lewisville | TX | $1,102 | 0.50% | 1.50% |
| New Orleans | LA | $1,092 | 0.00% | -0.70% |
| Syracuse | NY | $1,091 | 1.00% | 5.80% |
| West Jordan | UT | $1,088 | 0.70% | 5.00% |
| Stockton | CA | $1,083 | -0.20% | 6.30% |
| Greeley | CO | $1,080 | 0.20% | 9.00% |
| Houston | TX | $1,080 | 0.20% | 3.70% |
| Durham | NC | $1,074 | -0.10% | 4.00% |
| Colorado Springs | CO | $1,071 | -0.50% | 6.50% |
| Murfreesboro | TN | $1,067 | 0.40% | 3.90% |
| Peoria | AZ | $1,062 | 0.90% | 6.90% |
| West Valley City | UT | $1,059 | 0.20% | 1.80% |
| Wilmington | NC | $1,043 | -0.10% | 2.30% |
| Clovis | CA | $1,042 | 0.30% | 6.20% |
| Overland Park | KS | $1,042 | -0.10% | 2.70% |
| Baton Rouge | LA | $1,042 | -0.60% | -2.10% |
| Fort Worth | TX | $1,041 | -0.20% | 4.20% |
| Norfolk | VA | $1,036 | -0.10% | 3.20% |
| Boise | ID | $1,035 | 0.20% | 6.90% |
| Buffalo | NY | $1,033 | 0.30% | 3.00% |
| Victorville | CA | $1,031 | -0.50% | 6.10% |
| Grand Prairie | TX | $1,029 | -0.30% | 5.50% |
| Richmond | VA | $1,024 | 0.10% | 4.80% |
| Savannah | GA | $1,021 | 0.30% | 3.70% |
| Detroit | MI | $1,007 | -0.30% | 5.70% |
| Columbia | SC | $1,005 | 0.30% | 4.40% |
| Jackson | FL | $1,001 | 0.30% | 5.10% |
| Lakeland | FL | $1,000 | 0.90% | 6.50% |
| Cleveland | OH | $1,000 | -0.60% | 1.10% |
| Fresno | CA | $989 | 0.30% | 5.50% |
| Hampton | VA | $987 | 0.00% | 0.50% |
| Rochester | NY | $986 | 0.40% | 2.40% |
| North Las Vegas | NV | $982 | 0.40% | 8.70% |
| North Charleston | SC | $981 | 0.40% | 2.70% |
| San Antonio | TX | $981 | 0.10% | 2.10% |
| Garland | TX | $976 | -0.10% | 5.30% |
| Knoxville | TN | $972 | 0.80% | 3.70% |
| Arlington | TX | $971 | 0.10% | 5.70% |
| Las Vegas | NV | $969 | 0.10% | 6.60% |
| Salem | OR | $968 | 0.00% | 5.00% |
| Corpus Christi | TX | $964 | -0.30% | 2.20% |
| Grand Rapids | MI | $956 | -0.20% | 3.60% |
| Kansas City | MO | $955 | 0.70% | 4.70% |
| Phoenix | AZ | $954 | 1.00% | 5.40% |
| Waco | TX | $953 | -0.20% | -0.30% |
| Mesquite | TX | $949 | 1.00% | 5.00% |
| Cincinnati | OH | $938 | -0.10% | 3.80% |
| Bakersfield | CA | $937 | 0.10% | 2.20% |
| Waterbury | CT | $928 | 0.70% | 3.70% |
| Chattanooga | TN | $917 | -0.10% | 3.50% |
| Olathe | KS | $916 | 0.90% | 4.00% |
| Birmingham | AL | $915 | -0.40% | 1.90% |
| Mesa | AZ | $910 | 0.70% | 5.70% |
| Lubbock | TX | $910 | 0.70% | -4.80% |
| Lincoln | NE | $909 | -0.30% | 1.50% |
| Newport News | VA | $905 | 0.10% | 0.90% |
| Spokane | WA | $903 | 0.10% | 5.00% |
| South Bend | IN | $897 | 1.40% | 2.00% |
| Metairie | LA | $892 | -0.20% | 1.90% |
| Louisville | KY | $892 | 0.10% | 1.80% |
| Columbus | OH | $882 | 0.10% | 4.40% |
| Sterling Heights | MI | $881 | -0.60% | 4.60% |
| St. Louis | MO | $881 | 0.50% | 1.30% |
| Lexington | KY | $875 | -0.30% | 1.70% |
| Des Moines | IA | $872 | 0.00% | 1.00% |
| Omaha | NE | $869 | -0.20% | 2.10% |
| Glendale | AZ | $866 | -0.10% | 4.80% |
| Norman | OK | $864 | -0.10% | -2.70% |
| Pasadena | TX | $856 | 0.20% | 4.60% |
| Greensboro | NC | $841 | -0.20% | 4.00% |
| Albuquerque | NM | $836 | 0.00% | 2.30% |
| Columbus | GA | $835 | 0.40% | 1.50% |
| Paradise | NV | $827 | -0.50% | 4.70% |
| Indianapolis | IN | $818 | 0.00% | 2.60% |
| Akron | OH | $816 | -0.10% | 0.90% |
| Broken Arrow | OK | $803 | 0.40% | 1.40% |
| Tucson | AZ | $802 | 0.40% | 4.20% |
| Las Cruces | NM | $799 | 0.30% | 3.10% |
| Winston-Salem | NC | $794 | -0.10% | 4.70% |
| Macon | GA | $789 | 0.40% | 4.80% |
| Lansing | MI | $783 | 0.60% | 3.20% |
| Warren | MI | $773 | 0.40% | 3.10% |
| Mobile | AL | $773 | -0.40% | 0.30% |
| Little Rock | AR | $772 | 0.40% | 0.70% |
| Augusta | GA | $770 | 0.40% | 3.40% |
| Jackson | MS | $767 | 0.50% | 4.20% |
| McAllen | TX | $764 | 1.30% | -0.90% |
| Kansas City | KS | $759 | 0.30% | 0.10% |
| High Point | NC | $758 | -0.30% | 2.60% |
| Memphis | TN | $742 | 0.10% | 2.30% |
| El Paso | TX | $736 | -0.40% | 0.50% |
| Fort Wayne | IN | $733 | 0.40% | 5.20% |
| Oklahoma City | OK | $729 | 0.10% | 1.40% |
| Dayton | OH | $728 | 0.70% | 2.20% |
| Amarillo | TX | $725 | -0.40% | -0.10% |
| Independence | MO | $720 | 0.00% | 2.90% |
| Killeen | TX | $694 | -0.60% | 0.90% |
| Brownsville | TX | $683 | -1.20% | 1.00% |
| Toledo | OH | $678 | 0.30% | 2.10% |
| Tulsa | OK | $671 | -0.10% | 1.40% |
| Wichita | KS | $634 | 0.20% | 1.60% |
[mailmunch-form id=”583374″]
Methodology:
RentCafe is a nationwide apartment search website that enables renters to easily find apartments and houses for rent throughout the United States.
To compile this report, RentCafe’s research team analyzed rent data across the 250 cities in the US. The report is exclusively based on apartment data related to buildings containing 50 or more units. Our report includes cities with populations over 100,000 and a rental stock of at least 2,900 apartments in 50+ unit buildings.
In this report, large cities are cities with a population of 600,000 people or more, mid-sized cities are cities with a population between 300,000 and 600,000, and small cities are cities with a population of less than 300,000.
Rent data was provided by Yardi Matrix, a business development and asset management tool for brokers, sponsors, banks and equity sources underwriting investments in the multifamily, office, industrial and self-storage sectors. Rental rate coverage is for Market Rate properties only. Fully Affordable properties are not included in the Yardi Matrix rental surveys and are not reported in rental rate averages.
Starting with the January 2017 rent survey, Yardi Matrix is using a methodology that incorporates more properties into the sample which caused slight changes in overall rents and year-over-year changes compared to the previous reports. We expect this methodology adjustment to produce more accurate averages at the national and metro levels.
*National averages include 127 markets across the US, as reported by Yardi Matrix.
Fair use and redistribution
We encourage you and freely grant you permission to reuse, host, or repost the images in this article. When doing so, we only ask that you kindly attribute the authors by linking to RentCafe.com or this page, so that your readers can learn more about this project, the research behind it and its methodology.
Share this article:

Nadia Balint
Nadia Balint is a senior creative writer for RENTCafé. She covers news and trends in residential and commercial real estate and their impact on our everyday life, including rental housing, for-sale housing, real estate development, homeownership, market reports, insurance, landlord-tenant laws, personal finance, urban development, economy, sustainability, and social issues. Nadia holds a B.S. in Business Management from Northeastern Illinois University in Chicago. You can connect with Nadia via email.
Nadia’s work and expertise have been quoted by major national and local media outlets, including CNN, CNBC, CBS News, Curbed, The NY Post, The Chicago Tribune, The Denver Post as well as industry publications, such as GlobeSt, Bisnow, Inman News, Multifamily Executive, and The Commercial Real Estate Show. Nadia also wrote for Multi-Housing News, Commercial Property Executive, HubSpot, and more. Prior to entering the real estate industry, Nadia worked in the legal field, where she gained over 10 years of experience in business, corporate, and real estate law.
Sign up for The Ready Renter newsletter
Get our free apartment hunting guide — plus tips, trends, and research.
")

")

Related posts

Green flags vs. red flags: what to notice on every apartment tour
Finding a place online is the easy part. The apartment tour is where you find out what the photos left out. For a first-time renter,…

Renting like a local: 5 questions to ask before signing a lease in Boston
Boston is one of the most rewarding cities to call home. It’s walkable, full of history and packed with distinct neighborhoods that each have their…

Here’s how to get around Pittsburgh as a renter using public transit
Pittsburgh is a city of three rivers, steep ridges and nearly 450 bridges. All that terrain shapes how you get from your front door to…
Subscribe to
The Ready Renter newsletter


