Ohio Rents Increased in 2018, Toledo Saw the Biggest Spike in Prices
Share this article:


At the end of 2018, the national average rent reached $1,419, which shows a 3.1% year-over-year increase, according to apartment data from Yardi Matrix. The largest rent increases were registered by small cities, with Odessa, TX, Midland, TX, and Reno, NV the top three with the biggest jump in rents. Overall, only 8 out of 250 cities analyzed nationwide saw decreases in rent in last year, just 2 of which saw drops larger than 1%, Baton Rouge, LA, and College Station in Texas.
In Ohio, the overall growth trend for rental apartments mirrors the national trend. Although all six largest cities in the state featured rent increases this year, rent prices jumped the highest in Toledo, by 6% compared to 2017 prices. Toledo’s economic development outpaced that of Columbus, Cleveland, and Cincinnati in 2017, and its impact was felt in 2018 in the price of rents, among other things. As more jobs are created, the demand for housing rises as well, and with that prices grow. Rents in Cleveland and Columbus also rose faster than the national average rate of 3.1%, with rents rising 3.8% and 3.6% respectively, compared to last year. The price of apartments in Dayton and Akron have increased the least over the past year.
2018 rent trends at a glance in Ohio’s largest cities:
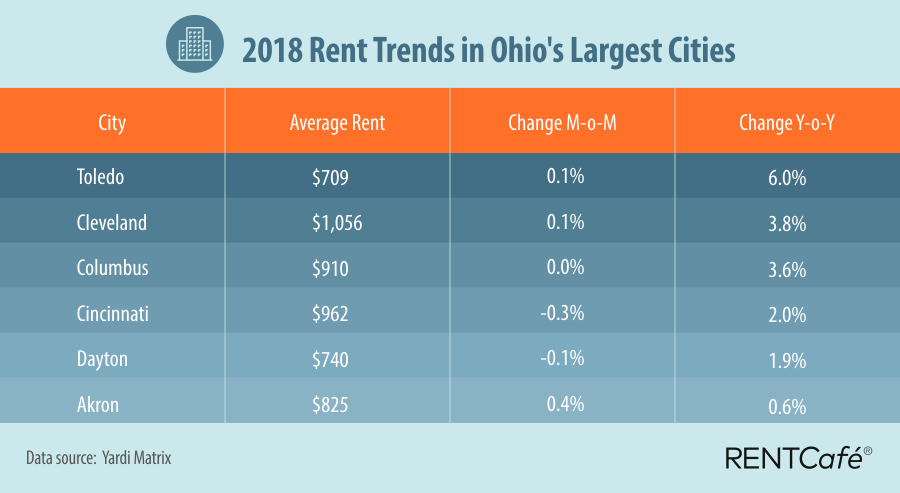
Rent prices in Ohio are generally well below the national average, with Cleveland apartments the most expensive, at an average rent of $1,056 per month. The second and third most expensive in the state are Cincinnati apartments for rent with an average rent of $962 per month, and Columbus apartments, where rents reached $910 per month at the end of the year. Of the state’s 6 largest cities, Toledo rental apartments are still the most affordable, with the average price just over $700 per month, in spite of the big increase it saw this past year, while Dayton apartments are the second most affordable, at $740 per month.
To compare the rental market in Ohio with other cities in the U.S., check out the full report here.
Methodology:
RentCafe is a nationwide apartment search website that enables renters to easily find apartments and houses for rent throughout the United States.
To compile this report, RentCafe’s research team analyzed rent data across the 252 largest cities in the US. The report is exclusively based on apartment data related to buildings containing 50 or more units. Our report includes cities with populations over 100,000 and a rental stock of at least 2,900 apartments in 50+ unit buildings.
In this report, large cities are cities with a population of 600,000 people or more, mid-sized cities are cities with a population between 300,000 and 600,000, and small cities are cities with a population of less than 300,000.
Rent data was provided by Yardi Matrix, a business development and asset management tool for brokers, sponsors, banks and equity sources underwriting investments in the multifamily, office, industrial and self-storage sectors. Rental rate coverage is for Market Rate properties only. Fully Affordable properties are not included in the Yardi Matrix rental surveys and are not reported in rental rate averages.
Share this article:


Mihaela Buzec
Mihaela Buzec is a senior writer, researcher, and online content developer for RentCafe, where she has over 7 years of experience writing about the real estate industry. She authors important resources such as the statistics pages describing generational patterns and renter's guides that help renters in their journey. Her work has appeared in publications such as Apartment Therapy, Indy Star, and Investopedia.
Mihaela is a published researcher who is active in academia as well. She holds a BA in English, an MA in linguistics, and a PhD in neurolinguistics.
Sign up for The Ready Renter newsletter
Get our free apartment hunting guide — plus tips, trends and research.




Related posts

Millionaire renters more than triple in 5 years, nearly half are Millennials
The number of millionaire renter households in the U.S. grew 229% between 2020 and 2024, more than tripling in just five years. While New York…

Detroit vs Chicago: Which Midwest city is more affordable for renters?
Detroit and Chicago are about 280 miles apart, making a move between the two a realistic option for many Midwestern renters. Maybe you’ve landed a…

Public transit options for renters in Newark, NJ: How to get around without a car
Newark renters can live car-free using PATH, NJ Transit rail, the Newark Light Rail and an extensive bus network, with Manhattan reachable in about 20…
Subscribe to
The Ready Renter newsletter