Apartment Rents Begin to Lose Steam in July as the Monthly Rate Reaches $1,469
Share this article:
Key takeaways:
- The national average rent reached $1,469 in July, up by 3.4% ($48) year-over-year, and 0.2% ($3) month-over-month, according to data from Yardi Matrix.
- 64% of the 260 cities included have rents below the national average, while 36% have average rents above.
- The average rent in the country’s most affordable city, Wichita, KS, reached $660, while the average rent in Manhattan was $4,222.
The national average rent inches up another $3 in July, reaching $1,469 per month
Nationally, the average rent went up by 3.4% year-over-year, reaching $1,469 in July. Overall, renters had to pay $48 more than they did at the same time last year, according to the latest rent survey from Yardi Matrix. However, July also displayed the slowest month-over-month increase since February, which at 0.2% is a clear signal that peak rental season is nearing its end. The trend is in line with last year’s data – once the busy late spring to early summer period winds down, rents are expected to slow their growth throughout the rest of the year.
A slowdown in month-over-month rent increases is visible across the U.S. Only 8 out of the 260 cities in the study saw month-over-month jumps of more than 1%. At the same time, 64% reported rents below the $1,469 national average. Wichita remains the most affordable city in the country, with an average apartment rent of $660, with Tulsa ($697) closely following it as the only other city where rents haven’t surpassed the $700 mark yet. Meanwhile, Toledo ($724) comes in third in affordability for the third month in a row. The usual suspects, Manhattan ($4,222), San Francisco ($3,706) and Boston ($3,528), continue their reign as the most expensive places to rent in.
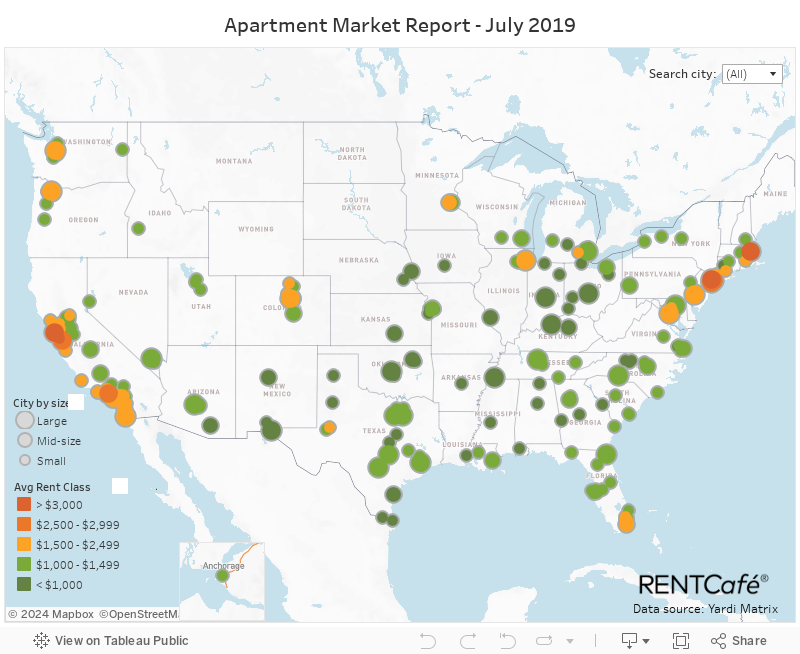
Check out the interactive map below to find out more about average rent prices in small, mid-sized, and large U.S. cities
Rents in the largest renter hubs increase by an average of $64
Overall, rents in the largest hubs increased by an average of $64 year-over-year, by net numbers ranging from a symbolic $7 in Houston ($1,103) to a significant $119 in the nation’s priciest market, Manhattan ($4,222).
Rents continue to rise partly because more and more Americans are looking for apartments while too few are being built. Doug Ressler, Manager of Business Intelligence at Yardi Matrix, explains that a slow recovery in construction has led to a nationwide housing shortage. The number of households is now rising at the same level as in the 1990s and early 2000s, but apartment development is not keeping up with demand, leading to rising prices.
Still, a majority of the mega-hubs – 65%, to be exact – had rents below the $1,469 national average. After a $34 year-over-year increase, Indianapolis ($875) remains the most affordable renter hub, succeeded by Columbus ($941), and San Antonio ($1,043). Unsurprisingly, rents continued to rise in the priciest of the nations’ renter mega-hubs, with apartments in Los Angeles ($2,516) going up by $112, and Washington DC apartment rents ($2,224) increasing by $87. Seattle ($2,141) came in fourth and is the last city on the list with an average rent above $2,000.
Some other large renter mega-hubs that made it to our ranking include Chicago; Denver; Philadelphia; Portland, OR; Texas’ Austin, Dallas, Fort Worth, and El Paso; Nashville, TN; and Florida’s Orlando and Jacksonville.
Renters still pay a premium to live in large Northeastern and Western cities
With the exception of Brooklyn ($2,924), where the 1.4% ($41) month-over-month increase is pushing the average rent closer to the $3,000 threshold, all of the top five priciest large cities saw rents increase by less than 1%. The rent in Manhattan increased slightly month-over-month in July and reached an average of $4,222. San Francisco came in second with a $3,706 average rent while Boston ($3,528) came in third. San Jose ($2,792) wraps up the top five with the slowest month-over-month rise, 0.1% ($3).
On the affordable side, Oklahoma City takes the top spot on the list of the cheapest large cities with its $775 average rent. And at just $4 more expensive than first place, El Paso apartments ($779) take second place. Memphis ($806) pushes the large city average rent into the $800s, followed by Indianapolis ($875). Columbus ($941) is the only city in the top five to exceed the $900 limit.

Californian mid-sized cities priciest in their category
After a 1.9% ($52) increase, the highest out of all mid-sized cities, Oakland’s average rent reached $2,854 in July, continuing its upward trend. Coming in second but at a significant $777 lower, Long Beach registered a $2,077 rent average. The two cities are followed by Santa Ana ($1,936), Anaheim ($1,809) and Miami, which at $1,729 is the only mid-sized city outside of California to make it to the Top 5 most expensive for renting.
The cheapest mid-sized cities to rent in have kept their spots in the ranking since last month, as their rents increased by no more than 0.6%. With an average of $660, Wichita is still the most affordable mid-sized city to rent in. Meanwhile, at number two on the list, Tulsa apartments cost $697 on average, while Tucson came in third with $875. At $894, the average rent in Albuquerque has neither increased nor decreased since June. Lexington wraps up the top five and nears the $1,000 mark with a $922 average.
See the complete list of cities at the end of this report

Midwestern and Southern small cities offer the lowest rents
The five small cities with the lowest rents all registered averages in the $700s. Toledo had a $724 average rent in July, keeping its title as the most affordable small city to rent in. In the meantime, Amarillo ($736) barely outpriced Brownsville ($733), while Killeen ($755) is yet again the third Texan city to make it to the Top 5. The average rent in Independence ($757) hasn’t changed since last month.
San Mateo ($3,361) is still the priciest small city to rent in, displaying a 0.4% ($14) month-over-month increase. It’s followed by Ivy Plus hub Cambridge ($3,236) and tech haven Sunnyvale ($3,067). Santa Clara ($2,978) and Jersey City ($2,951) are also in the top five most expensive small cities for renters.
Stamford, CT; Bellevue, Vancouver, Tacoma and Everett, WA; Yonkers, NY; Boulder and Thornton, CO; Fort Lauderdale, Davie, Coral Springs, Gainesville, Clearwater, Tallahassee, St. Petersburg and Pembroke Pines, FL; Providence, RI; Alexandria, VA; Edison, Newark and Elizabeth, NJ; Eugene, OR; Salt Lake City; and Durham and Wilmington, NC, also secured spots in our ranking.

Interest in 1-bedroom apartments is rising on RentCafe
With 43% renters searching for 2-bedroom apartments, they’re still the most popular unit type on RentCafe.com. However, for the past two months, 1-bedroom apartments have been catching up. If searches for 1-bedroom apartments fell to 26% in May, since then, they’ve bounced back, now adding up to 30% of all searches. 3-bedroom apartments, meanwhile, make up 15% of searches, while studios are still the least popular on the platform, with a share of 12%.
Curious about rents in cities like Portland, Las Vegas, or Chicago? Check the average rent price in your city by using this interactive table:
Methodology:
RentCafe.com is a nationwide apartment search website that enables renters to easily find apartments and houses for rent throughout the United States.
To compile this report, RentCafe’s research team analyzed rent data across the 260 largest cities in the US. The data on average rents comes directly from competitively-rented (market-rate) large-scale multifamily properties (50+ units in size), via telephone survey. The data is compiled and reported by our sister company Yardi Matrix, a business development and asset management tool for brokers, sponsors, banks and equity sources underwriting investments in the multifamily, office, industrial and self-storage sectors. Fully-affordable properties are not included in the survey and are not reported in rental rate averages. The national average rent includes over 130 markets across the U.S., as reported by Yardi Matrix.
Fair use and redistribution
We encourage you and freely grant you permission to reuse, host, or repost the images in this article. When doing so, we only ask that you kindly attribute the authors by linking to RentCafe.com or this page, so that your readers can learn more about this project, the research behind it and its methodology. For more in-depth, customized data, please contact us at media@rentcafe.com.
Share this article:

Irina Lupa
Irina Lupa is a creative writer for several Yardi publications, where they cover real estate market trends and industry news. Their work has been cited in Forbes, Globe St. and CNBC, among others. Irina has an academic background in journalism and media theory. You can connect with Irina via email.
Sign up for The Ready Renter newsletter
Get our free apartment hunting guide — plus tips, trends, and research.
")

")

Related posts

Renting like a local: 5 questions to ask before signing a lease in Boston
Boston is one of the most rewarding cities to call home. It’s walkable, full of history and packed with distinct neighborhoods that each have their…
Public transit in White Plains, NY: A renter’s guide to getting around without a car
If you’re searching for apartments in White Plains, NY, how you’ll get around should weigh just as heavily as the kitchen layout or the closet…

Millennial housing report: Where they’re buying homes and where they’re still renting
There’s more to Millennials than brunches and air fryers. In recent years, many have decided to settle down and buy homes. In fact, approximately 5.3…
Subscribe to
The Ready Renter newsletter

