Share this article:


Rental season got off to a tighter start this year, and nowhere is that clearer than in Miami, where about 16 renters now compete for every open apartment. While competition eased across much of the country throughout the last year, it’s building again as peak season begins.
So, if you’re refreshing listings every morning and watching the good ones disappear before you can even book a tour, you’re reading the market right. The pressure is not spread evenly, though. A few markets are pulling far ahead of the pack, and a few others are quietly giving renters room to breathe. Here’s where the competition is fiercest this season, where it’s easing and how to give yourself the best shot at the apartment you want.
Key takeaways:
- Miami is the toughest large market in the country with a Rental Competitiveness Index (RCI) score of 91.1, nearly 96% of apartments occupied and the fiercest competition of any major metro.
- Tech hubs are gaining heat the fastest. Silicon Valley posted the largest year-over-year jump among large markets at 7.6 points, followed closely by Chicago, the San Francisco Peninsula and Milwaukee.
- Lehigh Valley, PA, leads the small markets with an RCI score of 89 with Amarillo, TX, and Palm Beach County, FL, right behind.
- Manhattan, NY, climbed into the top five large markets, with the Big Apple coming in with nearly 96% of apartments occupied and demand that keeps outpacing new supply.
- The Northeast (RCI score: 80.4) is the most competitive region for renters, edging out Florida and the Midwest.
- Some markets are cooling: Eastern Los Angeles County saw the steepest year-over-year competitiveness score drop, handing renters there some real breathing room.
Where is it hardest to rent this peak season? To find out, RentCafe.com analyzed Yardi data across 139 of the largest U.S. markets using five factors:
- How many renters competed for each available apartment
- How many renters decided to renew and stay put
- How long it took for an apartment to fill
- The share of apartments that were occupied
- The share of apartments that were newly built
Apartment-hunting heats back up along with the summer moving season
The U.S. rental market started the peak season with an RCI of 75.6 out of 100, which was up about a point from 74.6 a year ago. A one-point rise is a modest move, but a score above 70 still signals a tight market. However, what stands out is the long-term trend: After a year of gentle easing, competition is building again, rather than winding down.
The numbers underneath tell a more layered story. For example, about eight people now compete for each vacant apartment, down from nine a year ago. At the same time, apartments get filled in roughly 50 days, up from 46.
What’s tightening the market is supply and staying power. Recently built apartments represent 0.51% of all rentals nationwide, down from 0.72% a year ago. Additionally, about two-thirds of renters (65.1%) renewed their leases rather than move, an increase from 63.8%.
When two out of three renters stay put and construction slows, the apartments that do open up can sometimes draw a small crowd.
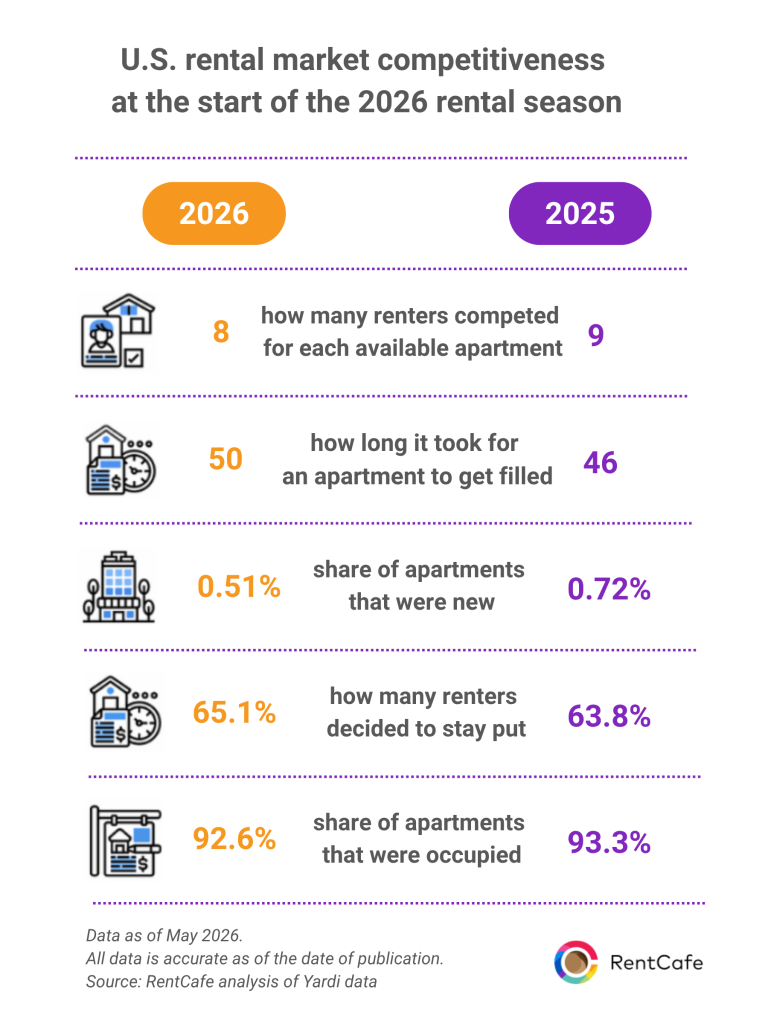
Here’s what that feels like on the ground: With more than nine in 10 apartments occupied at any given moment, fewer than eight units out of every 100 are even available. The slightly longer fill times help, but in the hottest markets, a good apartment is still gone in a month or less. So, heading into the peak season for apartment searching, preparation and speed make the difference.
Tech hubs heating up fastest
California’s Silicon Valley saw the biggest year-over-year jump in rental competitiveness of any large market after climbing 7.6 points to 86.9 to rank third nationwide. The engine is artificial intelligence. AI companies have been the most active force in the Bay Area office market by signing the largest leases — including 14 of the 100 biggest U.S. office leases in 2025 for a total of 4.3 million square feet — and bringing the most workers back, which feeds straight into apartment demand.
At the same time, new construction in the area has nearly stopped, with newly built units at just 0.13% of the local housing stock. Occupancy sits above 95% and about 13 renters now line up for every vacancy.
The San Francisco Peninsula tells the same story from a different starting point, rising 6.9 points to reach an RCI score of 78.6 as the share of new apartments shrank and demand picked back up.
Chicago is right alongside the West Coast tech hubs, up 7.5 points to 88.6 for the second-most-competitive large rental market in the country. The driver here is supply: Barely any new apartments have opened recently, and newly built units make up just 0.16% of rentals in the area. Vacant apartments fill in about 44 days, occupancy is above 95% and demand runs about 15 renters deep for every opening.
The squeeze doesn’t stop at the city line, either. Suburban Chicago ranks sixth with an RCI score of 84 due to its sky-high 73.3% renewal rate. So, the vacant apartments that do appear are scarce on both sides of Chicagoland.
Milwaukee made one of the season’s biggest moves after jumping 6.7 points to an RCI score of 85.2 to land in the top five. Apartment completions have fallen to their lowest level in years as higher financing costs and fewer build-ready parcels slowed development. Plus, downtown employers calling workers back to the office have kept demand strong. Renewals are high at 73.8%, occupancy holds at 95% and each opening draws about a dozen applicants. For renters, that combination of affordable rents, steady jobs and a shrinking pipeline is exactly what keeps a market tight.
Top 10 trending rental markets at start of 2026 rental season
North Bay, CA
Data as of May 2026. All data is accurate as of the date of publication.
Source: RentCafe analysis of Yardi data

Miami remains red-hot, Chicago & Silicon Valley close behind
If you’re searching in Miami, you already know how it goes, and the data backs it up: Miami remains the most competitive large rental market in the country with an RCI score of 91.1. About 16 renters compete for every available apartment — the highest of any major metro — and nearly 96% of units are already taken. What’s more, roughly three in four current renters renewed their leases, so few apartments ever return to the open market.
What keeps Miami this tight is steady population growth. The city has long attracted high-income professionals moving from the coasts as well as retirees and international renters. As such, demand keeps outrunning the supply of mid-priced apartments while developers focus on luxury projects.

What stands out this season is how the pressure has shifted toward supply and staying power. Fewer renters are competing head-to-head than a year ago, but with construction slowing and more people renewing, the apartments that do open move fast. Tech-driven metros and a tight Northeast are leading that trend.
Chicago holds second at 88.6 and Manhattan, NY, climbs to fifth at 84.2. Even though the New York metro is the nation’s busiest apartment builder, demand in Manhattan still outpaces the new supply. Nearly 96% of apartments are occupied, close to three in four renters are renewing their leases rather than move, and a strong return-to-office pull keeps competition high. The result is a lot of renters chasing relatively few openings.
Rounding out a strong South Florida showing at seventh, Broward County, FL, is where a supply shortfall and continued demand from high-income relocators keep options scarce.
Top 30 most competitive rental markets at start of 2026 rental season
| Rank | Market | Competitive score |
Average vacant days |
Occupied apartments |
Prospective renters |
Lease renewal rate |
Share of new units |
|---|---|---|---|---|---|---|---|
| 1 | Miami, FL | 91.1 | 38 | 95.9% | 16 | 1.6% | |
| 2 | Chicago, IL | 88.6 | 44 | 95.3% | 15 | 0.2% | |
| 3 | Silicon Valley, CA | 86.9 | 40 | 95.4% | 13 | 0.1% | |
| 4 | Milwaukee, WI | 85.2 | 48 | 95.0% | 12 | 0.3% | |
| 5 | Manhattan, NY | 84.2 | 48 | 95.8% | 10 | 0.1% | |
| 6 | Suburban Chicago, IL | 84 | 48 | 94.4% | 10 | 0.1% | |
| 7 | Broward County, FL | 83.8 | 46 | 94.7% | 12 | 0.6% | |
| 8 | Eastern Virginia, VA | 82.3 | 45 | 93.4% | 10 | 0.3% | |
| 9 | Grand Rapids, MI | 82.3 | 45 | 94.9% | 9 | 0.4% | |
| 10 | Suburban Philadelphia, PA | 81.4 | 53 | 94.2% | 10 | 0.2% | |
| 11 | Lansing – Ann Arbor, MI | 81.2 | 47 | 95.1% | 8 | 0.0% | |
| 12 | Cincinnati, OH | 80.5 | 50 | 93.3% | 11 | 0.2% | |
| 13 | Kansas City, MO | 80.3 | 48 | 92.6% | 7 | 0.1% | |
| 14 | San Diego, CA | 79.9 | 44 | 94.4% | 11 | 0.6% | |
| 15 | Oklahoma City, OK | 79.9 | 44 | 91.6% | 7 | 0.1% | |
| 16 | Orange County, CA | 79.7 | 49 | 95.2% | 11 | 0.3% | |
| 17 | Suburban Twin Cities, MN-WI | 79.5 | 49 | 94.3% | 10 | 0.4% | |
| 18 | Orlando, FL | 79.2 | 46 | 93.1% | 8 | 0.8% | |
| 19 | San Francisco Peninsula – North Bay, CA |
78.6 | 45 | 94.5% | 11 | 0.3% | |
| 20 | Greater Boston, MA | 78.4 | 50 | 93.7% | 9 | 0.2% | |
| 21 | East Bay, CA | 78.1 | 49 | 94.2% | 11 | 0.1% | |
| 22 | Jacksonville, FL | 77.7 | 47 | 91.9% | 8 | 0.5% | |
| 23 | Bridgeport – New Haven, CT | 77.6 | 51 | 93.2% | 9 | 0.5% | |
| 24 | Central Valley, CA | 77.5 | 48 | 95.6% | 11 | 0.6% | |
| 25 | Philadelphia, PA | 77.2 | 54 | 92.6% | 10 | 0.3% | |
| 26 | North Jersey, NJ | 77 | 50 | 94.5% | 9 | 1.3% | |
| 27 | Pittsburgh, PA | 76.8 | 51 | 93.3% | 8 | 0.4% | |
| 28 | Queens, NY | 76.7 | 53 | 95.4% | 11 | 1.3% | |
| 29 | Brooklyn, NY | 76.4 | 50 | 94.7% | 7 | 1.1% | |
| 30 | Detroit, MI | 76.4 | 55 | 92.7% | 8 | 0.1% |
Source: RentCafe analysis of Yardi data
Quieter markets climbing fastest
The small markets gaining ground the fastest are not the usual names. Montana posted the biggest year-over-year jump of any small market, climbing 11 points to an RCI score of 73.7. It’s not among the most competitive markets overall, but the shift is striking: With about seven renters now competing for each opening and a renewal rate near 57%, a state that’s better known for wide-open spaces is tightening quickly as more people move in and stay.
Neighboring South Dakota tells a similar story, rising 9.8 points to 76.7 as steady demand met a market with almost no new construction. Amarillo, TX, climbed 9.4 points and lands among the most competitive small markets outright at second, while White Plains, NY, and Reno, NV, round out the fastest risers, up 8.3 and 6.9 points, respectively. For renters, the takeaway is that competition is no longer confined to the big, coastal and Sun Belt hubs. Instead, some of the sharpest moves this year are happening in smaller, more affordable places that had plenty of room a year ago.
Top 10 trending small rental markets at start of 2026 rental season
Data as of May 2026. All data is accurate as of the date of publication.
Source: RentCafe analysis of Yardi data
Lehigh Valley, PA, and Amarillo, TX, top most competitive small markets
Small metros are no easy alternative this season. Lehigh Valley, PA, leads all small markets with an RCI score of 89 fueled by an 81.8% renewal rate — one of the highest among all markets analyzed. When that many renters stay put, the few openings that surface draw heavy interest.
Amarillo, TX, comes in second (RCI score: 87.6), after rising 9.4 points year-over-year. Here, it takes just 28 days for vacant apartments to be filled — among the fastest in the country — especially as no new units were built recently. With an economy supported by aerospace and defense alongside agriculture and food processing (plus demand from renters priced out of bigger metros) supply simply can’t keep up.
Palm Beach County, FL, jumps to the third spot (RCI score: 87). This area has earned the “Wall Street South” label as hundreds of financial firms have relocated or expanded there in recent years, drawn by Florida’s lack of a state income tax. That wave of high-earning professionals has kept apartments scarce, with roughly a dozen applicants for every available unit and no newly built units this period.
Port St. Lucie, FL, is the biggest climber in the group, after vaulting to fourth (RCI score: 86) from 47th a year ago. The Treasure Coast city is drawing renters priced out of south Florida’s larger metros, and with more than three in four renters renewing their leases, the roughly 11 people chasing each opening face very little turnover.
Top 30 most competitive small rental markets at start of 2026 rental season
| Rank | Market | Competitive score |
Average vacant days |
Occupied apartments |
Prospective renters |
Lease renewal rate |
Share of new units |
|---|---|---|---|---|---|---|---|
| 1 | Lehigh Valley, PA | 89 | 50 | 95.6% | 13 | 0.4% | |
| 2 | Amarillo, TX | 87.6 | 28 | 95.6% | 10 | 0.0% | |
| 3 | Palm Beach County, FL | 87 | 46 | 94.4% | 12 | 0.0% | |
| 4 | Port St. Lucie | 86 | 46 | 95.3% | 11 | 0.4% | |
| 5 | Lexington, KY | 85.9 | 46 | 94.1% | 13 | 0.0% | |
| 6 | Harrisburg, PA | 85.8 | 49 | 95.2% | 12 | 0.5% | |
| 7 | Fort Wayne, IN | 84.9 | 45 | 94.9% | 8 | 0.0% | |
| 8 | Rochester, NY | 84.8 | 50 | 94.3% | 10 | 0.0% | |
| 9 | South Bend, IN | 84.1 | 40 | 95.7% | 8 | 0.2% | |
| 10 | Youngstown, OH | 83.4 | 54 | 94.9% | 11 | 0.0% | |
| 11 | Lubbock, TX | 83.3 | 36 | 93.7% | 10 | 0.2% | |
| 12 | Fayetteville, AR | 83.3 | 33 | 94.8% | 8 | 1.3% | |
| 13 | Providence, RI | 83.3 | 54 | 95.1% | 11 | 0.2% | |
| 14 | Jackson, MS | 83.1 | 45 | 93.3% | 9 | 0.0% | |
| 15 | Columbia, SC | 82.8 | 45 | 93.3% | 13 | 0.6% | |
| 16 | Worcester – Springfield, MA | 82.8 | 51 | 95.5% | 15 | 0.6% | |
| 17 | Columbus, GA | 82.6 | 44 | 93.3% | 8 | 0.0% | |
| 18 | Little Rock, AR | 82.5 | 44 | 92.4% | 7 | 0.0% | |
| 19 | Albany, NY | 82.4 | 53 | 93.8% | 10 | 0.1% | |
| 20 | Wichita, KS | 82.2 | 38 | 95.2% | 10 | 1.2% | |
| 21 | White Plains, NY | 81.7 | 56 | 95.3% | 12 | 0.4% | |
| 22 | Knoxville, TN | 81.5 | 42 | 94.6% | 9 | 0.6% | |
| 23 | Buffalo, NY | 80.7 | 53 | 92.5% | 10 | 0.7% | |
| 24 | Augusta, GA | 80.7 | 50 | 91.6% | 9 | 0.0% | |
| 25 | Dayton, OH | 80.6 | 47 | 94.4% | 9 | 0.5% | |
| 26 | Toledo, OH | 80.5 | 54 | 94.7% | 9 | 0.4% | |
| 27 | Spokane, WA | 80.4 | 52 | 95.0% | 15 | 0.9% | |
| 28 | Lafayette-Lake Charles, LA | 80.2 | 36 | 91.3% | 7 | 0.5% | |
| 29 | Lafayette, IN | 80.1 | 44 | 95.2% | 6 | 0.3% | |
| 30 | Long Island, NY | 80.1 | 53 | 93.7% | 7 | 0.1% |
Source: RentCafe analysis of Yardi data
Lexington, KY, ranks fifth (RCI score: 85.9). Here, the University of Kentucky and a growing health care and biotech base keep demand steady year-round amid limited new construction.
Albany, NY, lands at 19th with state government, several universities and the largest population gain among New York metros drawing renters from pricier downstate markets into a tight Capital Region.
One significant shift in this category: Wichita, KS, the small-market leader for early 2026, eased to 20th with an RCI score of 82.2. After a year when almost nothing was built, new apartments finally opened, lifting the share of recently built units to 1.17% of the stock and giving renters there a bit more choice. The aerospace- and defense-driven economy still keeps the market competitive, but the supply relief is real.
Renters face toughest search in Northeast with Florida & Midwest close behind
Zooming out to the regional level, the Northeast takes the top spot as the rental season heats up with an RCI score of 80.4, just ahead of Florida at 79.6 and the Midwest at 79.3. Northeast renters renew at the highest average rate in the country, 73.2%, which keeps vacancies scarce from Pennsylvania’s Lehigh Valley to upstate New York.
A few factors are working together across these regions. First, construction has stayed light, which keeps supply tight. At the same time, rents in the Midwest and parts of the Northeast remain more affordable than the coasts, drawing a steady stream of renters who might be priced out elsewhere. And once those renters settle in, they tend to stay. By contrast, California leads on a single measure with about 11 renters competing for each opening, even as its lower renewal rates pull down its overall score.
Where renters are catching a break
Not every market is tightening. Several have moved the other way in the last year, giving renters more room to negotiate and more time to choose. In particular, eastern Los Angeles County cooled the most of any market after dropping 10.4 points as apartments took longer to fill and fewer renters competed for each unit.
Brooklyn, NY, also loosened up, and a handful of Midwest small markets — including Madison, WI, and Lafayette, IN — eased as new apartments came online. So, if you’re searching in one of these areas this season, you have more leverage than renters in most of the country.
FAQ
A: Among large markets, Miami leads with about 16 renters compete for every opening. Among small markets, Lehigh Valley, PA, tops the list.
A: Silicon Valley posted the biggest jump among large markets, rising 7.6 points year-over-year, followed by Chicago, the San Francisco Peninsula and Milwaukee. Among small markets, Montana, South Dakota and Amarillo, TX, tightened the most.
A: On a national level, it is getting a little harder. The U.S. RCI rose to 75.6 from 74.6 a year ago. The shift is driven by slower construction and more renters renewing, rather than by a surge of head-to-head competition, which actually eased slightly.
A: The Northeast leads all regions with an average RCI score of 80.4, just ahead of Florida and the Midwest. High renewal rates and limited new construction keep vacancies scarce.
A: Eastern Los Angeles County saw the biggest decline, falling 10.4 points. Brooklyn, NY, and several Midwest small markets — including Madison, WI, and Lafayette, IN — also loosened up as new apartments arrived.
A: It’s a score from zero to 100 that combines five things — how long an apartment took to fill, the share of apartments occupied, how many renters competed for each vacancy, how many renters renewed their leases and how much new construction reached the market. The higher the score, the harder it is to land an apartment.
Methodology
To compile this report, RentCafe.com’s research team analyzed Yardi apartment data across 139 rental markets in the U.S. The data comes from market-rate, large-scale, multifamily properties of at least 50 units. Fully affordable multifamily properties were excluded. All data is accurate as of the date of publication.
Markets were ranked on a competitiveness score built from five metrics and their averages for the most recent quarter (January, February, March): apartment occupancy rate, average total days vacant, prospective renters per vacant unit, lease renewal rate and the share of new apartments completed during the same period.
Each metric carries a percentage weight: 30% for occupancy rate, 15% for average vacant days, 15% for prospective renters per vacant unit, 30% for renewal rate and 10% for the share of new apartments. Markets above roughly 80,000 units are grouped as large markets and those below as small markets, with the same locations kept consistent year-over-year. The terms “market,” “area,” “metro” and “location” are used interchangeably and follow Yardi Matrix market definitions.
Fair use and redistribution
We encourage you and freely grant you permission to reuse, host or repost the research, graphics and images presented in this report. When doing so, we ask that you credit our research by linking to RentCafe.com or this page, so that your readers can learn more about this project, the research behind it and its methodology. For more in-depth, customized data, please contact us at media@rentcafe.com.
Share this article:


Florin Petrut
Florin Petrut is a real estate writer and research analyst with RentCafe, using his experience as a social media specialist and love for storytelling to create insightful reports and studies on the rental market. With a strong interest in the renter experience, he develops data-driven resources that explore cost of living, affordable neighborhoods, and housing trends, helping renters make informed decisions about where and how they live. Florin holds a B.A. in Journalism and an M.A. in Digital Media and Game Studies.
Sign up for The Ready Renter newsletter
Get our free apartment hunting guide — plus tips, trends and research.




Related posts
August 2026 self storage report: Rents fall 2.2% annually as most major cities post street rate declines
National street rates averaged $134 per month in August 2026, down 2.2% year-over-year and off 0.7% from July. 71% of the 150 largest U.S. cities…
Best cities for renters to live in 2026: McKinney, TX, leads again in a South-dominated top 50
For the second year in a row, McKinney, TX, holds the top spot in RentCafe.com’s ranking of the best cities for renters. This year, Southern…

The money talk you need to have with your roommate before you co-sign a lease
Before you co-sign a lease with a roommate, you need to have an honest conversation about money. A jointly signed lease means both renters share…
Subscribe to
The Ready Renter newsletter