Mid-year Renter Engagement Tracker: Miami jumps 130 spots as Minneapolis holds #1
Share this article:


The first half of 2026 brings notable shifts in where renters are searching for apartments. Miami makes the biggest jump in the ranking, climbing 130 spots to reach the top 30 for the first time. Renter interest in the city is surging with saved searches rising by 81% and listings added to favorites increasing by 31%. And Miami isn’t the only new arrival — another 17 cities join the list, most of them from the South and West.
Key takeaways:
- Minneapolis is the most sought-after city among renters in the first half of 2026. The city's strong and diversified job market continues to draw renter interest.
- Atlanta ranks second, followed by St. Paul, MN, at #3; Miami at #4; and the Bronx, NY, rounding out the top five.
- Miami makes the biggest leap among all cities, climbing 130 positions compared to last year's mid-year ranking. Ongoing migration from the Northeast and the continued relocation of finance and tech firms to South Florida are fueling the momentum.
- The West remains the most in-demand region for the second straight quarter, placing 10 cities in the national top 30 — up from just six compared to 2025.
Minneapolis remains the most in-demand city for renters in the first half of the year. The city earned its position on the strength of saved searches — where it ranks first nationally — paired with a steady rise in listings added to favorites. Washington, D.C., which led for much of 2025, drops to #10 this time around.
Not to be outdone, Atlanta takes second place after consistently drawing strong interest from renters throughout the first six months of the year. St. Paul, MN, follows at #3; with Miami is at #4; and the Bronx, NY, rounds out the top five with all three cities seeing more listings saved as favorites.
Regionally, the West remains the most in-demand region — a major shift from mid-2025, when the South led with 14 cities in the national top 30 and the West had just six. However, this year, 10 Western cities land in the national top 30, followed by the South with eight, the Midwest with seven and the Northeast with five.
As renters save favorites and create searches while looking for their next apartment, their behavior suggests growing intentionality — namely, less casual browsing and more active narrowing of options.
Need more context? Revisit our reports on renter engagement in the first quarter of 2026 and the top-trending cities to watch this year to see how renter interest has evolved throughout the year.
Minneapolis is the most sought-after city by renters in the first half of 2026
1. Minneapolis, MN
Minneapolis remains the top city for renter interest so far in 2026, with listings added to favorites and saved searches increasing by 12% and 10%, respectively, to help the city maintain its position at the top of the ranking.
- The city ranks 17th for total page views.
- Listings added to favorites jumped by 12% compared to last year.
- Saved searches grew by 10%.
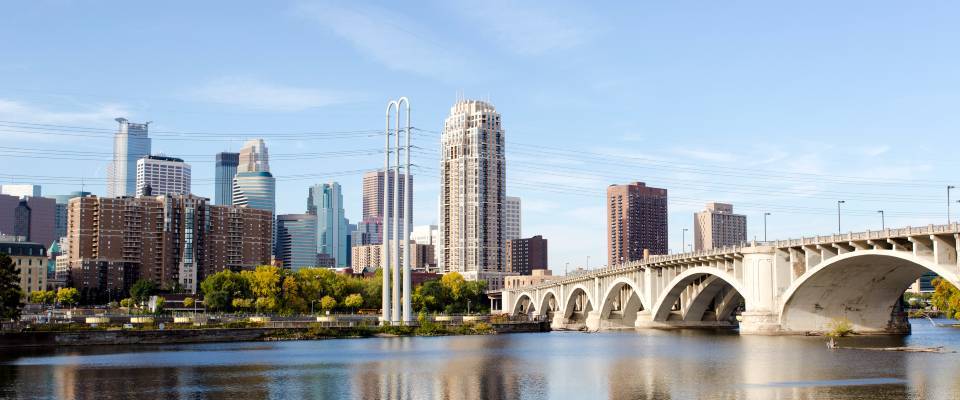
Minneapolis gives renters plenty of ways to enjoy city life, from walkable neighborhoods and extensive transit connections to a dynamic arts, dining and entertainment scene. Its mix of urban amenities and easy access to the wider Twin Cities area makes it an appealing choice for renters seeking both convenience and variety.
Renters in Chicago; St. Paul, MN; and New York City show the strongest interest in Minneapolis listings.
2. Atlanta, GA
Climbing three spots to reach #2, Atlanta stands out for its strength of renter interest. The city leads the ranking for listings added to favorites and ranks second for saved searches — clear signs that renters are actively exploring the market and keeping track of potential homes.
- The city placed 16th for browsing activity.
- Atlanta ranks first for listings added to favorites.
- The city ranks second for saved searches.
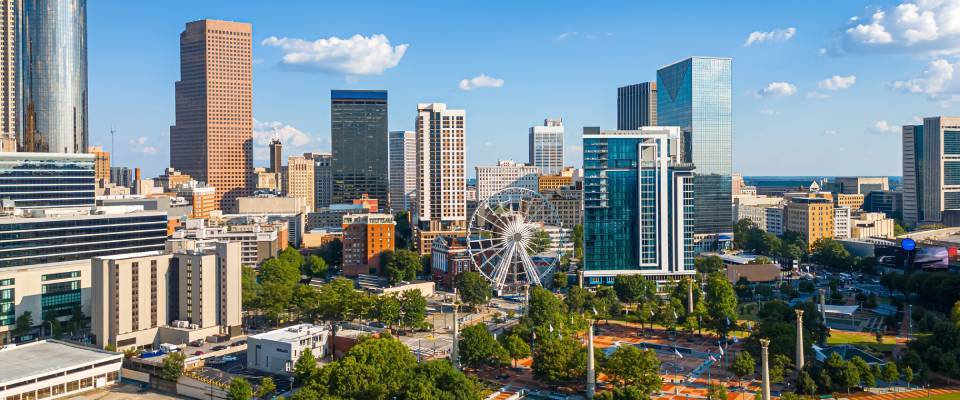
As a major employment hub, Atlanta is home to prominent companies including The Coca-Cola Company, Delta Air Lines and The Home Depot. At the same time, its growing cultural scene, green spaces and extensive transit network add to the city’s appeal for renters.
Renters in New York City; Chicago; and Marietta, GA, account for the highest search activity in Atlanta listings.
3. St. Paul, MN
In third place, St. Paul is drawing steady attention from those looking for a new home, with 6% more renters browsing listings and 1% more adding them to their favorites than a year ago.
- Page views increased by 6%.
- Renters here saved 1% more listings.
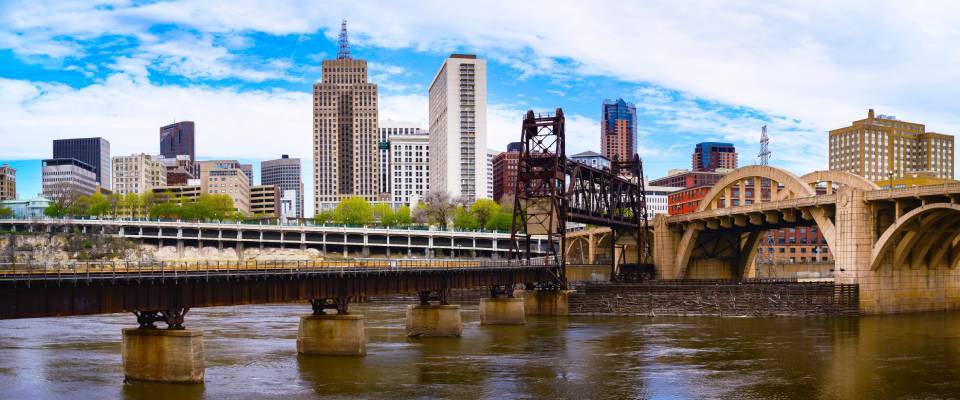
With major employers such as Ecolab, Securian Financial and 3M in the broader Twin Cities area, St. Paul offers renters access to a diverse employment base. The city also combines a more laid-back feel with walkable neighborhoods, green spaces and easy access to Minneapolis.
Renter demand for St. Paul listings comes primarily from renters already in the area, including those in Minneapolis.
Top 30 cities for renter engagement
in the first half of 2026
| Rank | City, state | REnT* score | Change vs. first half of 2025 |
|---|---|---|---|
| 1 | Minneapolis, MN | +3 | |
| 2 | Atlanta, GA | +3 | |
| 3 | St. Paul, MN | +7 | |
| 4 | Miami, FL | +130 | |
| 5 | Bronx, NY | +33 | |
| 6 | Oakland, CA ** | +40 | |
| 7 | Cincinnati, OH | -4 | |
| 8 | Philadelphia, PA | +0 | |
| 9 | San Francisco, CA | +64 | |
| 10 | Washington, D.C. | -9 | |
| 11 | Baltimore, MD | +43 | |
| 12 | Spokane, WA | +49 | |
| 13 | El Paso, TX | +68 | |
| 14 | San Jose, CA | +11 | |
| 15 | Tampa, FL | +17 | |
| 16 | Long Beach, CA | +0 | |
| 17 | Chicago, IL | -11 | |
| 18 | Newark, NJ | +29 | |
| 19 | Milwaukee, WI | +43 | |
| 20 | Tucson, AZ | +77 | |
| 21 | Portland, OR | -2 | |
| 22 | Detroit, MI | +44 | |
| 23 | Los Angeles, CA | -16 | |
| 24 | Jersey City, NJ | +19 | |
| 25 | Austin, TX | +107 | |
| 26 | Dallas, TX | +49 | |
| 27 | Anaheim, CA | +31 | |
| 28 | Cleveland, OH | -16 | |
| 29 | Las Vegas, NV | -20 | |
| 30 | Pittsburgh, PA | +56 |

4. Miami, FL
Miami is drawing strong renter interest, after surging 130 positions to land at #4. The city stands out for especially strong growth in renter activity with its listings added to favorites increasing by 31% and saved searches by 81%.
- The city ranks third for total page views.
- Bookmarked listings rose by 31%.
- Renters created 81% more saved searches.
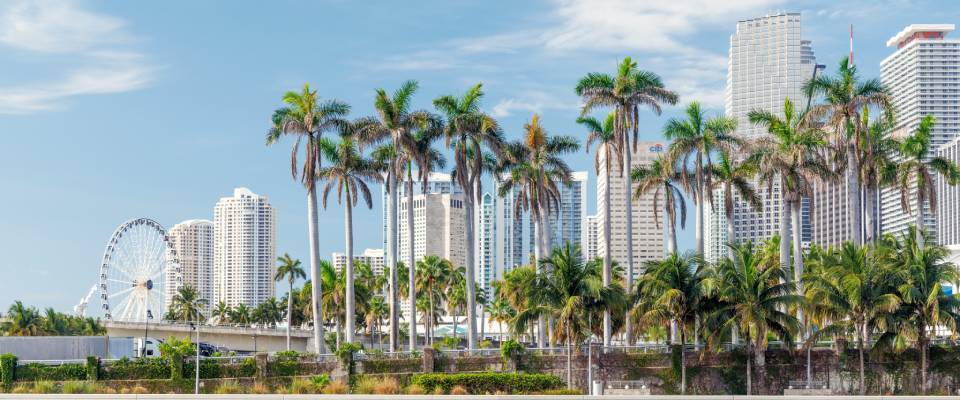
In addition to its warm climate and coastal lifestyle, Miami offers renters a diverse economy spanning finance, professional services, technology, trade and tourism. Here, major employers include Carnival Corporation, Bacardi and Ryder System. Plus, Florida’s lack of a state personal income tax can also appeal to higher earners and professionals relocating from other states, while renting gives newcomers the flexibility to explore Miami’s neighborhoods before committing to a longer-term move.
Miami draws its heaviest renter engagement from three cities — New York City; Orlando, FL; and Chicago.

Miami and San Francisco are two cities that tell a compelling story about what renters are looking for right now. Miami climbed 130 positions, with saved searches surging 81% — a sign that renters are not just curious, but also getting closer to making a decision. Meanwhile, San Francisco’s jump of 64 spots suggests that even in a higher-cost market, renters are drawn to cities that offer walkable neighborhoods, strong career opportunities and a quality of life that’s hard to replicate. Both cities reflect a broader trend: Renters are thinking more intentionally about where they want to live, weighing lifestyle and long-term fit alongside affordability.
5. Bronx, NY
The Bronx is emerging as a hotspot for renter activity, after rising 33 positions since last year. While the borough ranks among the top markets for overall browsing activity, the sharp 74% rise in listings added to favorites suggests that more renters are shortlisting homes they want to revisit.
- The city placed 10th for browsing activity.
- Listings added to favorites jumped by 74%.
- Saved searches climbed by 1%.
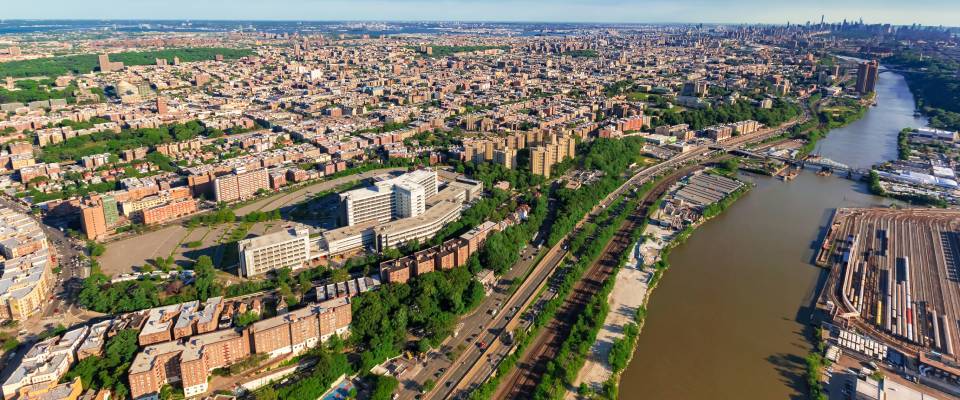
The Bronx offers renters the advantage of proximity to Manhattan, NY, and a diverse local economy, along with easy access to popular urban amenities such as the Bronx Zoo, New York Botanical Garden and Yankee Stadium.
Of all markets, Chicago sends the most engaged renters to Bronx listings.
6. Oakland, CA
Oakland is gaining a strong foothold among the markets attracting renter attention by ranking seventh for overall browsing activity after rising 40 spots since last year. The city even edged out Cincinnati by the slimmest of margins with the two markets running nearly neck and neck in overall score. Oakland has also seen significant gains in the number of listings and searches that renters save for later, up 27% and 22%, respectively.
- The city ranks seventh for total page views.
- Favorites grew by 27% compared to last year.
- Renters created 22% more saved searches.
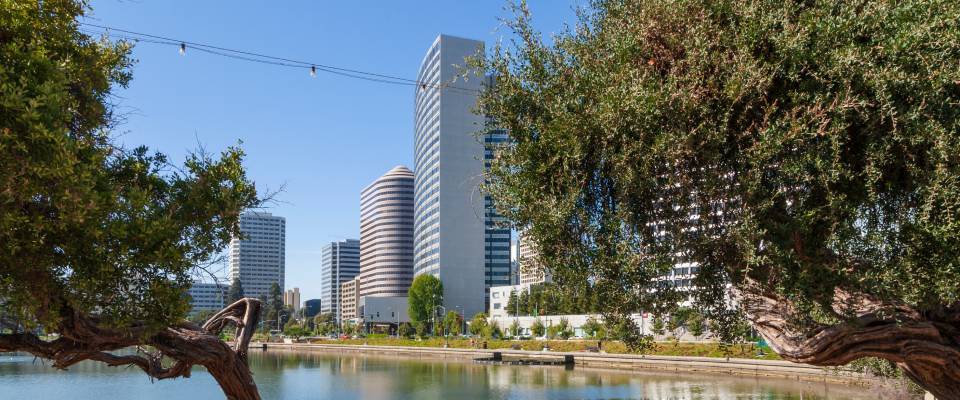
With major employers such as Kaiser Permanente, Blue Shield of California and Clorox in the East Bay, Oakland gives renters access to a diverse job market while offering a more urban, neighborhood-focused alternative to nearby San Francisco.
Renter traffic to Oakland, CA, listings is concentrated among renters in San Francisco; San Jose, CA; and Los Angeles.
7. Cincinnati, OH
In seventh place after slipping four spots since last year, Cincinnati remains a strong contender for renters, ranking among the top markets for both listings added to favorites and saved searches. Its solid position for overall page views further reflects the level of attention that renters are giving the city.
- The city placed 13th for browsing activity.
- Cincinnati ranks fourth for listings added to favorites.
- The city placed sixth for saved searches.
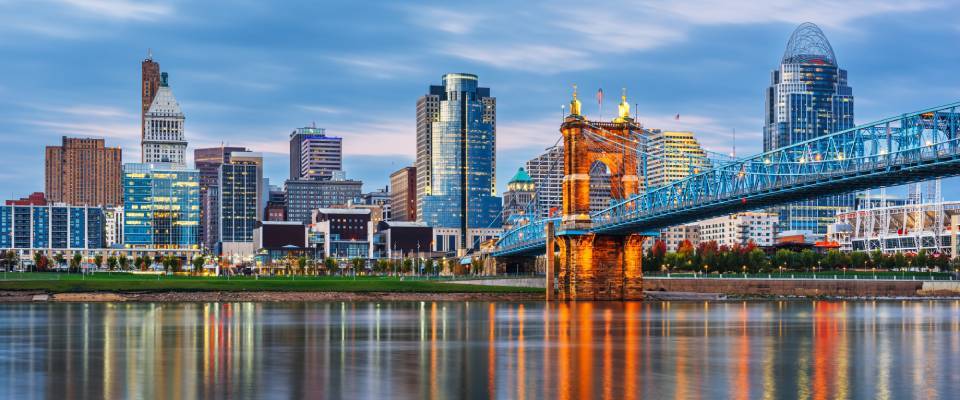
A diverse economy — anchored by employers such as Kroger; Procter & Gamble; and Fifth Third Bancorp — gives Cincinnati a strong employment base, while its historic neighborhoods, riverfront setting and growing food and arts scene add to its appeal for renters.
Three cities (Columbus, OH; Chicago; and New York City) account for the strongest renter interest in Cincinnati listings.
8. Philadelphia, PA
Philadelphia is seeing steady growth in search activity, landing at #8 after renters bookmarked 11% more listings and saved 15% more searches than they did a year ago. These gains suggest that renters are not simply browsing the market, but also comparing their best options side by side.
- Listings added to favorites jumped by 11% compared to last year.
- Renters here created 15% more saved searches.
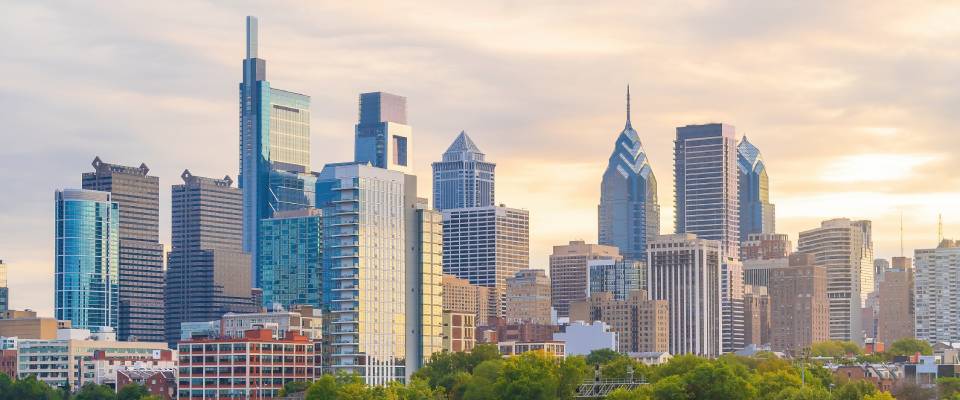
Thanks to major employers such as Comcast, Independence Blue Cross and Aramark, Philadelphia offers a broad employment base alongside walkable neighborhoods, historic character and a wealth of cultural attractions.
Chicago; Newark, NJ; and New York City are the primary sources of renter engagement for Philadelphia listings.
9. San Francisco, CA
After jumping 64 spots since last year, San Francisco breaks into the top 30, drawing plenty of attention from those searching for a new home. What’s more, the city places among the leading markets for overall browsing activity while also seeing a noteworthy 16% increase in listings that renters are marking as favorites.
- The city placed 15th for browsing activity.
- Bookmarked listings rose by 16%.
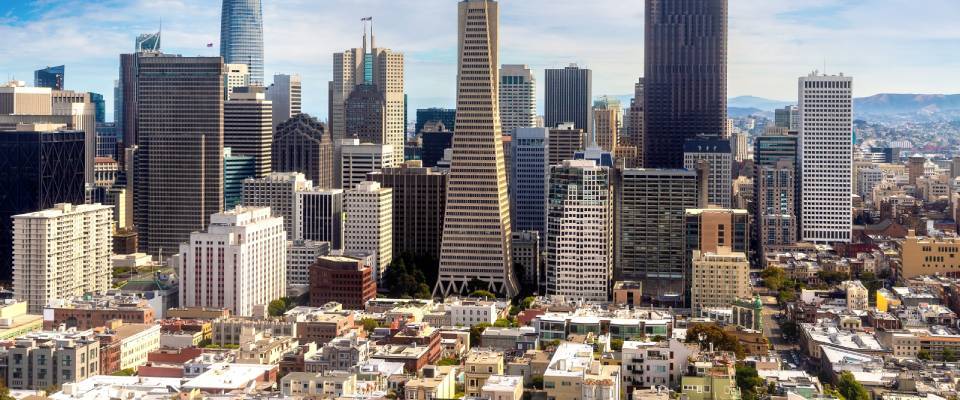
San Francisco continues to draw renters with its mix of distinctive, walkable neighborhoods; convenient urban amenities; and proximity to major employers, including Salesforce, Wells Fargo and Kaiser Permanente. The combination of career opportunities and access to the Bay Area’s many amenities may help explain the city’s surge in renter interest through mid-year 2026 — showing that, even with its higher cost of living, San Francisco continues to offer a day-to-day appeal that few cities can rival.
Renters in San Jose, CA; Los Angeles; and New York City engage with San Francisco listings more than any other markets.
10. Washington, D.C.
Last year’s top city, Washington, D.C., rounds out the top 10. The capital is attracting focused renter interest with apartment-hunters ranking the capital among the strongest markets for both listings added to favorites and saved searches.
- The city ranks 21st for total page views.
- The capital placed fifth for listings added to favorites.
- D.C. ranks fourth for saved searches.
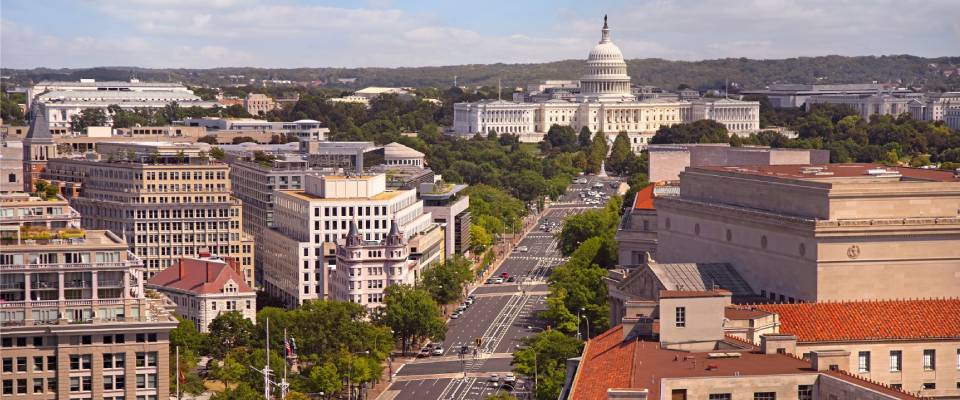
As a major center for government, business and professional services, D.C. appeals to young professionals because renters here have easy access to D.C.-based employers — such as Amazon, Capital One and Fannie Mae — alongside museums, restaurants, green spaces and extensive public transit.
Baltimore, Chicago and New York City drive more renter interest in Washington, D.C., listings than any other cities.
Meet the newcomers: 17 cities emerge as rising renter hotspots
The mid-year ranking welcomes 17 new cities to the top 30 compared to last year’s report, with Miami making the biggest leap of all by climbing 130 positions to reach #4. The South contributes the largest share of newcomers, followed by Western cities, such as Oakland, CA, and San Francisco.
Of the newcomers, six are from the South, five from the West, four from the Northeast and two from the Midwest.
- Miami — #4 in the U.S. and #2 in the South
- Bronx, NY — #5 nationally and #1 in the Northeast
- Oakland, CA — #6 in the U.S. and #1 in the West
- San Francisco — #9 nationally and #2 in the West
- Baltimore — #11 in the U.S. and #4 in the South
- Spokane, WA — #12 nationally and #3 in the West
- El Paso, TX — #13 in the U.S. and #5 in the South
- Tampa, FL — #15 nationally and #6 in the South
- Newark, NJ — #18 in the U.S. and #3 in the Northeast
- Milwaukee — #19 nationally and #5 in the Midwest
- Tucson, AZ — #20 in the U.S. and #6 in the West
- Detroit — #22 nationally and #6 in the Midwest
- Jersey City, NJ — #24 in the U.S. and #4 in the Northeast
- Austin, TX — #25 nationally and #7 in the South
- Dallas — #26 in the U.S. and #8 in the South
- Anaheim, CA — #27 nationally and #9 in the West
- Pittsburgh — #30 in the U.S. and #5 in the Northeast
Leading the newcomers is Miami, which lands at #4 nationally and #2 in the South. The city combines one of the highest levels of overall renter browsing activity with particularly strong growth in more active search behaviors: Listings added to favorites jumped 31%, while saved searches surged 81%. Together, those numbers suggest that Miami is attracting not only plenty of renters, but also renters who are filtering down to their best matches.
The Bronx, NY, and Oakland, CA, follow closely at #5 and #6, respectively. The Bronx saw listings added to favorites soar 74%, while Oakland posted gains of 27% in the same category and 22% in saved searches. Both markets also rank among the country’s busiest for page views, demonstrating that renter interest is translating into meaningful engagement with available homes.
Not far behind, San Francisco breaks into the top 30 at #9 nationally and #2 in the West. Specifically, the city ranks 15th for total page views and saw listings added to favorites climb 16%, further reinforcing its position as a market that continues to attract renters despite its relatively high cost of living. San Francisco’s strong showing, together with Oakland’s, underscores the continued draw of the broader Bay Area rental market.
The South has an especially strong presence among this mid-year’s newcomers, with Baltimore; El Paso, TX; Tampa, FL; Austin, TX; and Dallas joining Miami. Baltimore, in particular, has seen a surge in listings added to favorites, rising 128% compared to last year.
The West is not far behind with Spokane, WA; Tucson, AZ; and Anaheim, CA, rising 49, 77 and 31 positions, respectively, to join Oakland, CA, and San Francisco. Their presence points to continued interest in markets beyond the region’s biggest coastal hubs, thereby reflecting demand across the Pacific Northwest, Arizona and Southern California.
The Northeast also makes a strong showing with the Bronx, NY; Newark, NJ; Jersey City, NJ; and Pittsburgh entering the top 30, each ranking high in the page views category. The Bronx leads the group at #5, while Newark and Jersey City place #18 and #24, respectively, keeping the New York metropolitan area particularly well-represented. Pittsburgh rounds out the region’s presence in the ranking at #30.
Finally, Milwaukee and Detroit give the Midwest two spots, ranking #19 and #22. Their presence in the charts adds to the geographic diversity of the top 30, indicating that renter attention isn’t limited to the country’s largest coastal and Sun Belt markets.
Western cities take center stage in the first half of 2026 renter rankings
The West emerges as the most sought-after region for renters, surpassing last year’s leader — the South — with 10 cities in the national top 30. Then, the South follows with eight, the Midwest with seven and the Northeast with five.
West
The West moves into first place in this mid-year report, claiming more top-30 spots than any other region. Oakland, CA, and San Francisco lead the region, both placing in the top 10. Oakland ranks high in page views, while San Francisco stands out for listings added to favorites.
South
The South places eight cities in the top 30 with markets spanning the Southeast and reaching deep into Texas. Atlanta, Miami and Washington, D.C., lead the region with all three ranking high in the saved searches category.
Midwest
With Minneapolis in the top spot nationally, the Midwest places six more cities in the top 30. St. Paul, MN, and Cincinnati join Minneapolis in the top 10, continuing to draw renters who are browsing listings.
Northeast
The Northeast rounds out the regional picture with five cities in the top 30. The Bronx, NY, places near the top of the national ranking, while Philadelphia maintains its position from last year, giving the region two particularly notable performers.
Renter engagement in the 150 largest U.S. cities
in the first half of 2026
| Rank | City, state | Region | REnT* score | Change vs. first half of 2025 |
|---|---|---|---|---|
| 1 | Minneapolis, MN | Midwest | +3 | |
| 2 | Atlanta, GA | South | +3 | |
| 3 | St. Paul, MN | Midwest | +7 | |
| 4 | Miami, FL | South | +130 | |
| 5 | Bronx, NY | Northeast | +33 | |
| 6 | Oakland, CA ** | West | +40 | |
| 7 | Cincinnati, OH | Midwest | -4 | |
| 8 | Philadelphia, PA | Northeast | +0 | |
| 9 | San Francisco, CA | West | +64 | |
| 10 | Washington, D.C. | South | -9 | |
| 11 | Baltimore, MD | South | +43 | |
| 12 | Spokane, WA | West | +49 | |
| 13 | El Paso, TX | South | +68 | |
| 14 | San Jose, CA | West | +11 | |
| 15 | Tampa, FL | South | +17 | |
| 16 | Long Beach, CA | West | +0 | |
| 17 | Chicago, IL | Midwest | -11 | |
| 18 | Newark, NJ | Northeast | +29 | |
| 19 | Milwaukee, WI | Midwest | +43 | |
| 20 | Tucson, AZ | West | +77 | |
| 21 | Portland, OR | West | -2 | |
| 22 | Detroit, MI | Midwest | +44 | |
| 23 | Los Angeles, CA | West | -16 | |
| 24 | Jersey City, NJ | Northeast | +19 | |
| 25 | Austin, TX | South | +107 | |
| 26 | Dallas, TX | South | +49 | |
| 27 | Anaheim, CA | West | +31 | |
| 28 | Cleveland, OH | Midwest | -16 | |
| 29 | Las Vegas, NV | West | -20 | |
| 30 | Pittsburgh, PA | Northeast | +56 | |
| 31 | Birmingham, AL | South | +21 | |
| 32 | Grand Rapids, MI | Midwest | -18 | |
| 33 | Houston, TX | South | +56 | |
| 34 | Kansas City, MO | Midwest | -32 | |
| 35 | Orlando, FL | South | -12 | |
| 36 | Raleigh, NC | South | +71 | |
| 37 | Oklahoma City, OK | South | +103 | |
| 38 | Louisville, KY | South | -20 | |
| 39 | Richmond, VA | South | -10 | |
| 40 | Colorado Springs, CO | West | +83 | |
| 41 | San Antonio, TX | South | +63 | |
| 42 | Seattle, WA | West | +22 | |
| 43 | Denver, CO | West | +53 | |
| 44 | San Diego, CA | West | +57 | |
| 45 | Fresno, CA | West | +40 | |
| 46 | Baton Rouge, LA | South | +83 | |
| 47 | Overland Park, KS | Midwest | -34 | |
| 48 | Charlotte, NC | South | +65 | |
| 49 | Phoenix, AZ | West | +76 | |
| 50 | Boston, MA | Northeast | +27 | |
| 51 | Albuquerque, NM | West | +6 | |
| 52 | Brooklyn, NY | Northeast | +86 | |
| 53 | Salt Lake City, UT | West | +90 | |
| 54 | Jacksonville, FL | South | -12 | |
| 55 | Tacoma, WA | West | +44 | |
| 56 | Nashville, TN | South | +83 | |
| 57 | Fort Worth, TX | South | +84 | |
| 58 | Rochester, NY | Northeast | +52 | |
| 59 | Manhattan, NY | Northeast | +50 | |
| 60 | Omaha, NE | Midwest | -20 | |
| 61 | Irving, TX | South | +34 | |
| 62 | St. Louis, MO | Midwest | +38 | |
| 63 | Memphis, TN | South | +7 | |
| 64 | Aurora, CO | West | +66 | |
| 65 | Greensboro, NC | South | +40 | |
| 66 | Virginia Beach, VA | South | -36 | |
| 67 | Fontana, CA | West | +61 | |
| 68 | Mesa, AZ | West | +52 | |
| 69 | Bakersfield, CA | West | +52 | |
| 70 | Riverside, CA | West | +18 | |
| 71 | Port St. Lucie, FL | South | +9 | |
| 72 | Arlington, VA | South | -17 | |
| 73 | Indianapolis, IN | Midwest | -38 | |
| 74 | Chesapeake, VA | South | -48 | |
| 75 | San Bernardino, CA | West | -22 | |
| 76 | Sioux Falls, SD | Midwest | +8 | |
| 77 | Columbus, OH | Midwest | -66 | |
| 78 | Irvine, CA | West | +68 | |
| 79 | Providence, RI | Northeast | -12 | |
| 80 | Reno, NV | West | +14 | |
| 81 | Durham, NC | South | +22 | |
| 82 | Frisco, TX | South | +40 | |
| 83 | Fremont, CA | West | -15 | |
| 84 | Tempe, AZ | West | +18 | |
| 85 | Little Rock, AR | South | -57 | |
| 86 | Yonkers, NY | Northeast | -42 | |
| 87 | Tulsa, OK | South | -37 | |
| 88 | Garland, TX | South | +47 | |
| 89 | Salem, OR | West | -41 | |
| 90 | Santa Rosa, CA | West | +8 | |
| 91 | Arlington, TX | South | +36 | |
| 92 | Elk Grove, CA | West | +0 | |
| 93 | Queens, NY | Northeast | -22 | |
| 94 | Ontario, CA | West | -22 | |
| 95 | Chandler, AZ | West | +29 | |
| 96 | Moreno Valley, CA | West | -33 | |
| 97 | Winston-Salem, NC | South | -21 | |
| 98 | Vancouver, WA | West | +10 | |
| 99 | Peoria, AZ | West | +43 | |
| 100 | Des Moines, IA | Midwest | +26 | |
| 101 | Boise City, ID | West | +13 | |
| 102 | Newport News, VA | South | -68 | |
| 103 | Mobile, AL | South | -20 | |
| 104 | Norfolk, VA | South | -11 | |
| 105 | Knoxville, TN | South | -68 | |
| 106 | Santa Ana, CA | West | -65 | |
| 107 | Cary, NC | South | +4 | |
| 108 | New Orleans, LA | South | -91 | |
| 109 | Henderson, NV | West | +3 | |
| 110 | Augusta, GA | South | -89 | |
| 111 | Amarillo, TX | South | -96 | |
| 112 | Scottsdale, AZ | West | -52 | |
| 113 | Santa Clarita, CA | West | -64 | |
| 114 | Aurora, IL | Midwest | +33 | |
| 115 | Corpus Christi, TX | South | -79 | |
| 116 | Sacramento, CA | West | -89 | |
| 117 | Wichita, KS | Midwest | +1 | |
| 118 | Lexington, KY | South | -49 | |
| 119 | McKinney, TX | South | +30 | |
| 120 | Fort Lauderdale, FL | South | -100 | |
| 121 | Stockton, CA | West | -82 | |
| 122 | Fayetteville, NC | South | -77 | |
| 123 | Oxnard, CA | West | -45 | |
| 124 | Worcester, MA | Northeast | -9 | |
| 125 | Columbus, GA | South | -101 | |
| 126 | Gilbert, AZ | West | +18 | |
| 127 | Fort Wayne, IN | Midwest | -21 | |
| 128 | Chattanooga, TN | South | +3 | |
| 129 | Modesto, CA | West | -50 | |
| 130 | Lubbock, TX | South | -14 | |
| 131 | Akron, OH | Midwest | -72 | |
| 132 | St. Petersburg, FL | South | -99 | |
| 133 | Glendale, AZ | West | +4 | |
| 134 | Chula Vista, CA | West | -17 | |
| 135 | Laredo, TX | South | -84 | |
| 136 | Huntsville, AL | South | -49 | |
| 137 | Grand Prairie, TX | South | -55 | |
| 138 | Tallahassee, FL | South | -64 | |
| 139 | Toledo, OH | Midwest | +6 | |
| 140 | Huntington Beach, CA | West | -84 | |
| 141 | Plano, TX | South | -51 | |
| 142 | Lincoln, NE | Midwest | -51 | |
| 143 | Montgomery, AL | South | -121 | |
| 144 | Shreveport, LA | South | -79 | |
| 145 | Madison, WI | Midwest | -9 | |
| 146 | Buffalo, NY | Northeast | -13 | |
| 147 | Hialeah, FL | South | +1 | |
| 148 | North Las Vegas, NV | West | -29 | |
| 149 | Glendale, CA | West | -118 | |
| 150 | Cape Coral, FL | South | +0 |
FAQ
A: Minneapolis tops the ranking with a 12% increase in listings added to favorites and a 10% rise in saved searches compared to last year.
A: Miami climbed 130 positions to land at #4 nationally, with saved searches up 81% and listings added to favorites up 31%.
A: The West overtakes the South with 10 cities in the national top 30. Oakland, CA, and San Francisco lead the region, both ranking in the top 10.
A: Seventeen — six from the South, five from the West, four from the Northeast and two from the Midwest.
A: D.C. dropped from #1 to #10. It’s still one of the strongest markets for listings added to favorites and saved searches, but other cities have gained ground.
Methodology
RentCafe.com is a nationwide apartment search website that enables renters to easily find apartments and houses for rent throughout the U.S.
To compile this report, the research team analyzed RentCafe.com’s rental listing data across the 150 largest cities by population in the contiguous U.S. with a relevant listing inventory sample. The regions are defined according to the U.S. Census Bureau.
The report analyzes the first half of 2026 (from January through June) compared to the same six-month period in 2025.
The cities were ranked based on a city-level rental activity score. Full points were awarded to the most desirable city for a particular metric, while the zero-point level was set slightly below the worst city’s value. Cities that lacked sufficient information regarding specific metrics were awarded zero points.
To calculate each city’s score, we ranked them according to four metrics and their averages for the six months between January and June 2026 compared to the same six-month period in 2025.
1. Availability rate (Maximum score: 40 points)
The availability rate score was calculated by dividing the total vacant units at the city level for the most recent quarter by the total units and a year-over-year comparison of the same. The lowest rate received maximum points.
2. Page views (Maximum score: 30 points)
The page views score was calculated as the total number of page views for the most recent quarter at the city level divided by the total renter population in the city and a year-over-year comparison of the same. Page views are defined as a unique user interaction on a specific page in a 30-minute window.
3. Favorites (Maximum score: 15 points)
The favorites score was calculated as the total rental listings added to favorites at the city level for the most current quarter divided by the total renter population in the city and a year-over-year comparison of the same. A favorite is defined as a rental listing saved to favorites by a website visitor.
4. Saved searches (Maximum score: 15 points)
The saved searches score was calculated as the total number of saved searches at the city level for the most current quarter divided by the total renter population in the city and a year-over-year comparison of the same. A saved search is defined as a filtered/personalized apartment search saved by a website visitor.
Fair use and redistribution
We encourage and freely grant you permission to reuse, host, or repost the research, graphics and images presented in this article. When doing so, we kindly ask that you credit our research by linking to RentCafe.com or this page so that your readers can learn more about this project, the research behind it and its methodology. For more in-depth, customized data, please contact us at media@rentcafe.com.
Share this article:


Adina Dragos
Adina Dragos is a real estate writer and research analyst with RentCafe. She has solid experience in real estate writing, covering topics ranging from best cities for renters and the top cities for rental activity to cost of living. Her work was featured in several prominent media channels such as Axios, The Dallas Morning News, ConnectCRE and The New York Times.
Sign up for The Ready Renter newsletter
Get our free apartment hunting guide — plus tips, trends and research.




Related posts
Public transit in Arlington, VA: What renters need to know
If you’re apartment hunting in Arlington, VA, you’re already one step closer to a car-free lifestyle. Arlington is one of the most transit-friendly places in…

How much is your home office really costing you in rent?
Based on research by Hubble, using Yardi Matrix and CommercialCafe data. Read the original study on Hubble.A desk by the window beats working from the…

RentCafe Internet connects you to high-speed WiFi and entertainment services in one place
RentCafe partners with leading internet providers to bring reliable internet, streaming and mobile options directly to renters. Applicants and residents can browse and activate available…
Subscribe to
The Ready Renter newsletter