Share this article:
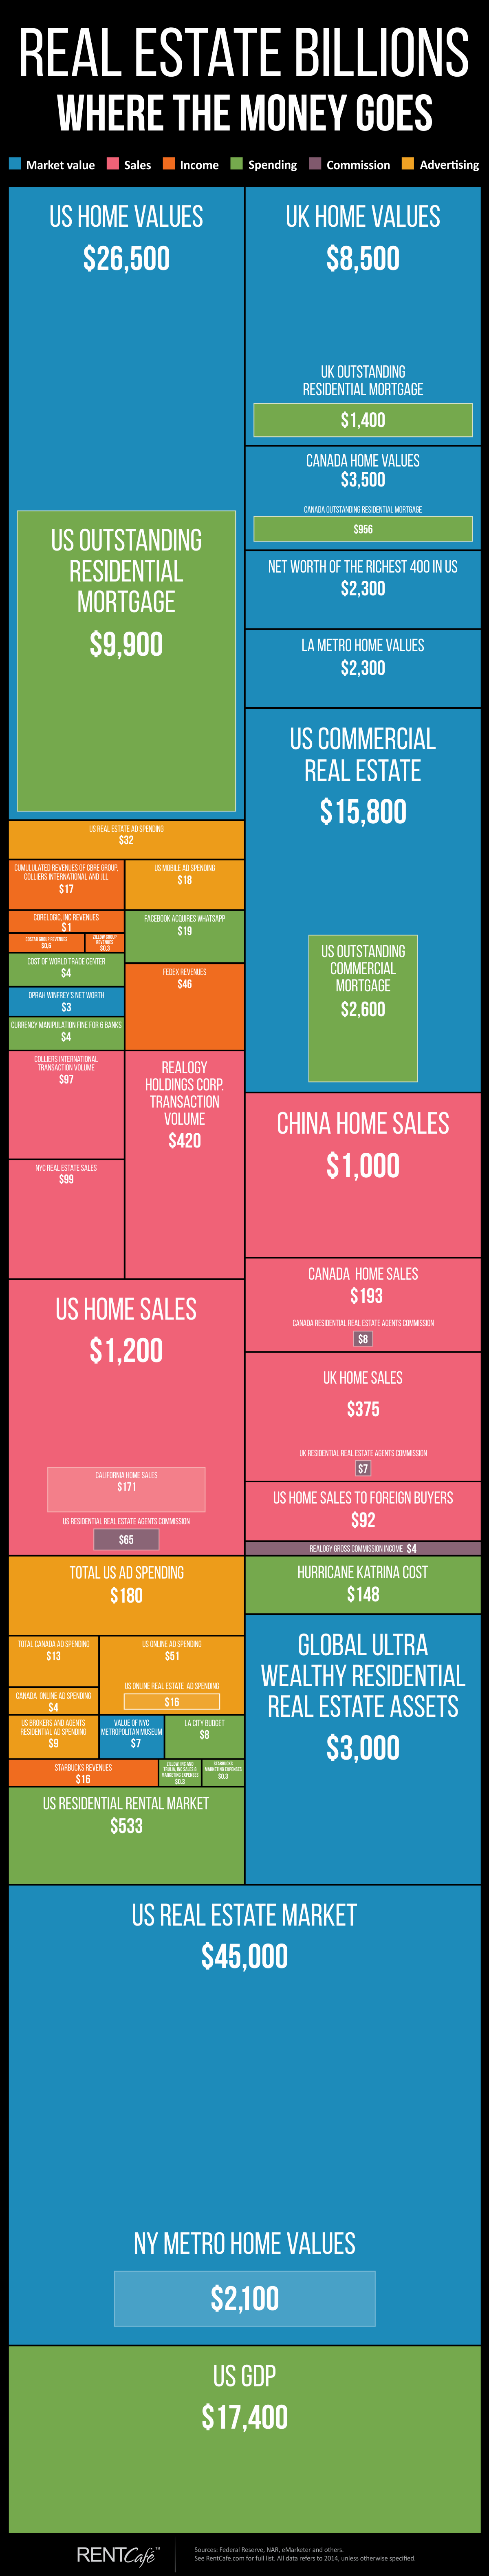
The real estate industry is a huge business which involves big spending and generates billions of dollars in revenue. But how much is a lot these days, and how do the sums encountered in real estate compare to those in other business sectors? RentCafe has looked into the billions game and compiled an infographic showing the cost of everything, from the US’s outstanding residential mortgage debt ($9,900B) to residential real estate agents’ commissions ($65B), and Oprah Winfrey’s net worth ($3B).
It’s no secret that it takes money to make money, but how much exactly for getting real estate sold? Total U.S. ad spending amounted to $180 billion last year, with $16 billion spent on online real estate marketing alone. Think this is mind-boggling? Wait till you see these other figures.
- The net worth of the 400 richest people in the U.S. is enough to buy all the homes in the L.A. metro area
- Facebook acquired WhatsApp for a little more than the total U.S. mobile ad spending
- Outstanding residential mortgage in the U.S. represents 37% of the value of all existing homes; in Canada, outstanding residential mortgage stands at 27% while in the UK it is about 16% of the total home values
- NYC real estate sales are approximately the same as sales of U.S. homes to foreign buyers
Check out more facts and connections in this cool visualization of real estate billions:
Use the code below to embed this infographic on your website:
*Disclaimer: To compile this infographic, RentCafe has collected data from several public sources and media reports, including the Federal Reserve, the National Association of REALTORS®, eMarketer, and others. Click here for the complete list of resources. This infographic has been produced for information purposes only and should not be considered as investment advice. Some numbers were rounded, estimated, and adapted to allow visualization.
Share this article:

Amalia Otet
Amalia Otet leads publishing and content for Yardi products, where she turns real estate data and market trends into stories that inform and inspire. Outside of work, Amalia strives to live beautifully - one green step at a time.
Sign up for The Ready Renter newsletter
Get our free apartment hunting guide — plus tips, trends, and research.
")

")

Related posts

Green flags vs. red flags: what to notice on every apartment tour
Finding a place online is the easy part. The apartment tour is where you find out what the photos left out. For a first-time renter,…

Renting like a local: 5 questions to ask before signing a lease in Boston
Boston is one of the most rewarding cities to call home. It’s walkable, full of history and packed with distinct neighborhoods that each have their…

Here’s how to get around Pittsburgh as a renter using public transit
Pittsburgh is a city of three rivers, steep ridges and nearly 450 bridges. All that terrain shapes how you get from your front door to…
Subscribe to
The Ready Renter newsletter


