Rent Continues to Climb in 93% of Cities, with Pressure Still on in the Largest Renter Hubs
Share this article:
Key takeaways:
- The national average rent registered a year-over-year increase of 3.3% ($45) in October, at $1,420 per month, according to data from Yardi Matrix.
- Among the nation’s biggest 252 cities, 93% have seen rent increases compared to October 2017, 6% remained flat, and only 1% of cities have seen their rents decrease Y-o-Y.
- Rents have increased the most in Phoenix, Las Vegas, and Jacksonville among the nation’s largest cities, while Queens, Baltimore, and Boston have stayed closest to last October’s average.

Season end brings rent growth to a halt, statistics suggest further increases
Although rent prices have stayed relatively flat since August, the national average clocking in at $1,420 in October, we are still seeing a strong 3.3% increase year-over-year. The U.S.-wide average monthly rent is $45 higher than the October 2017 level.
Doug Ressler, Director of Business Intelligence at Yardi Matrix is optimistic regarding the growth of the U.S. multifamily market. “A new trend is reversing recent years’ statistics, with demand now outpacing new supply. This is especially true in secondary cities and workforce housing.” According to the latest Yardi Matrix data, the third-quarter vacancy rates fell by 4.0%, and rents are projected to accelerate upwards over the next year.
Desert heat in autumn: Phoenix and Las Vegas rents outperform the largest renter hubs
Phoenix apartments have seen the fastest rent growth out of the 20 largest renter hubs, having registered an 8% increase over the past 12-month period. The average rent passed the $1,000 mark, up from $937 last October. Las Vegas took second place with a similarly impressive 7.8% boost since the same period in 2017, also passing the $1,000 threshold from $965 last October– the average price of apartments for rent in Las Vegas is now $1,040 according to the latest market data. Aggressive increases in Florida’s renter hubs have been keeping Orlando and Jacksonville near the top of this list over the past couple of months: The City Beautiful takes 3rd place in October with a 6.9% Y-o-Y increase, while Jacksonville is hot on Orlando’s heels with 6.8%.
One Year Rent Changes in 20 Renter Mega-Hubs October 2018
| City | October 2018 | October 2017 | Percentage Change | Net Change |
|---|---|---|---|---|
| Manhattan (New York City), NY | $4,181 | $4,021 | 4% | $160 |
| Los Angeles, CA | $2,454 | $2,305 | 6.5% | $149 |
| Washington, D.C. | $2,140 | $2,110 | 1.4% | $30 |
| Seattle, WA | $2,048 | $1,997 | 2.6% | $51 |
| Chicago, IL | $1,894 | $1,808 | 4.8% | $86 |
| Denver, CO | $1,608 | $1,526 | 5.4% | $82 |
| Atlanta, GA | $1,423 | $1,358 | 4.8% | $65 |
| Orlando, FL | $1,394 | $1,304 | 6.9% | $90 |
| Austin, TX | $1,363 | $1,308 | 4.2% | $55 |
| Tampa, FL | $1,294 | $1,223 | 5.8% | $71 |
| Charlotte, NC | $1,183 | $1,145 | 3.3% | $38 |
| Dallas, TX | $1,181 | $1,152 | 2.5% | $29 |
| Houston, TX | $1,091 | $1,072 | 1.8% | $19 |
| Fort Worth, TX | $1,084 | $1,041 | 4.1% | $43 |
| Jacksonville, FL | $1,061 | $993 | 6.8% | $68 |
| Las Vegas, NV | $1,040 | $965 | 7.8% | $75 |
| San Antonio, TX | $1,013 | $983 | 3.1% | $30 |
| Phoenix, AZ | $1,012 | $937 | 8.0% | $75 |
| Columbus, OH | $909 | $877 | 3.6% | $32 |
| Indianapolis, IN | $849 | $818 | 3.8% | $31 |
NATIONAL: Odessa and Midland rock-steady at the top, other top performers also keep up fast ascent
The oil industry has catapulted Odessa, TX, and Midland, TX to the top of the list a while ago, and rent increases attributable to vigorous job growth in the Permian Basin has ensured a long term leading position for both small cities. The average rents top last October’s figures by about 25%, although mid-season these growth rates were even higher, around 30%. The average rent in Odessa was 25.2% higher last month compared to the same period last year, having reached $1,368. Midland apartments have recorded a 23.3% increase in price over one year, costing $1,553 per month currently. In dollar value, this translates into a $275 upswing in Odessa and just under $300 in Midland, a $293 increase in just one year.
Reno, NV renters are getting accustomed to consistent double-digit rent hikes – this time the 12-month rent growth has pushed the average up by 11.2%. Third fastest nationally, the city’s average rent is currently at $1,257. Developers struggle to meet the growing demand, and the booming employment scene has pushed vacancy rates to extreme lows, fueling the confidence among property owners. The current average rent claims an additional $127 from a renter’s monthly income compared to the same period last year.

Rent decreases have been below 1% in most cities where renting has become cheaper in the past 12 months. Baton Rouge, LA and College Station, TX are the only exceptions with -2.1% and -1.6%, respectively, followed by Queens, NY (-0.9%), Norman, OK (-0.6%) and Stamford, CT (-0.4%).
LARGE CITIES: Phoenix and Las Vegas rule them all, East Coast cities see modest changes
Phoenix, AZ boasts the fastest growing rents among nation’s largest markets, where apartments now cost on average 8% more than just a year ago. The area attracts many renters who seek to escape the very same issue in big coastal markets, where affordability problems have made the $1,012 average rent offered by Phoenix appealing enough to justify a big lifestyle change.
Las Vegas, NV is also very popular among those who desire more affordable housing options, but the growing demand has pushed the average rent over the $1,000 mark in a year’s time in Sin City too. Renting an apartment now costs 7.8% more on average compared to last October. In absolute terms this means a $75 increase over 12 months, the exact same as in the case of Phoenix.
Jacksonville, FL rounds the podium where rent prices ticked up 6.8%, reaching the average of $1,061 in October, up $68 compared to last year’s same period.
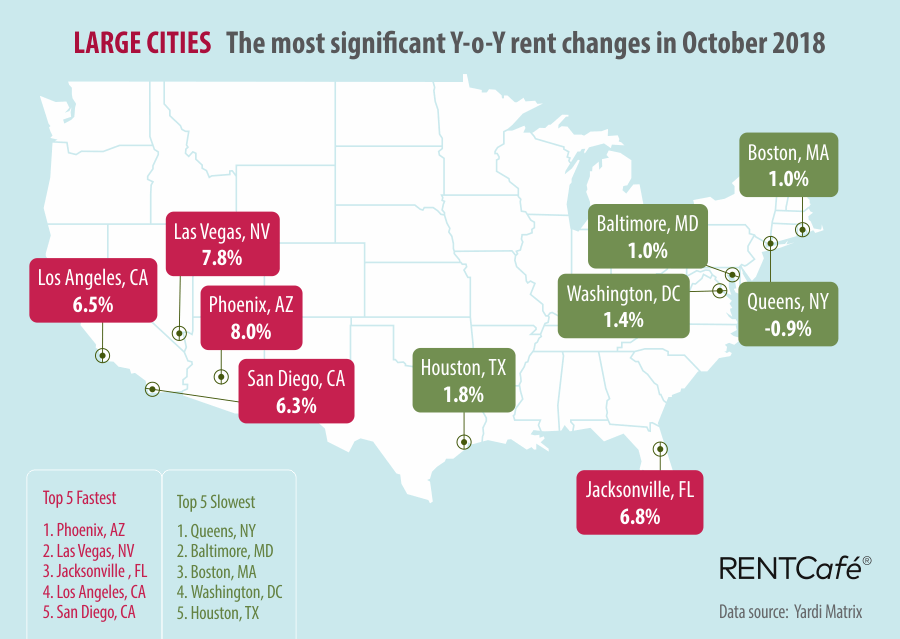
From the top of the list in September, the New York City borough of Queens slides straight to the bottom with a slight, 0.9% decrease in October. Baltimore, MD and Boston, MA follow neck-and-neck at exactly 1% over last October’s figure, while Washington, DC’s modest 1.4% rent growth is the fourth-to-last among big cities. The 1.8% Y-o-Y rent growth measured in Houston, TX is the fifth slowest in its size category.
See the complete list of cities at the end of this report.
MID-SIZE CITIES: Mesa and Sacramento rents spin up, limited increase in Tulsa
Apartments in Mesa, AZ have seen price increases of 8.7% on average in October, reaching $977. Sacramento, CA follows with 6.2% to the current average of $1,365, while Tampa, FL, Fresno, CA and Long Beach, CA have seen their rents grow at the same pace, 5.8% year-over-year. Apartments for rent in Tampa go for $1,294 on average as a result, Fresno’s average rent price has reached $1,042 and Long Beach renters paid $1,985 on average last month.
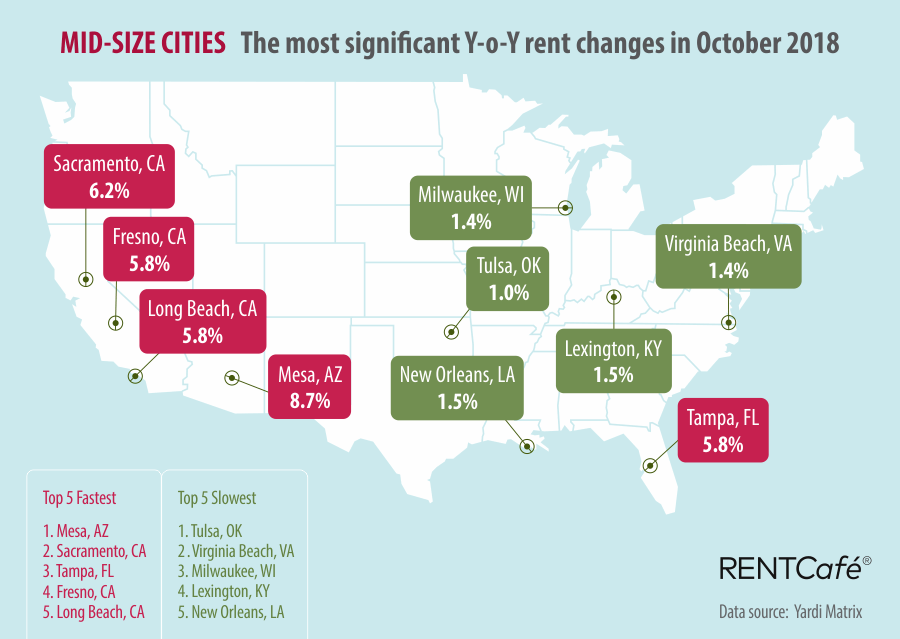
We have Tulsa, OK at the other extreme with the slowest increase recorded among mid-size cities, 1% Y-o-Y. The average rent in Tulsa is $684 at the moment. Virginia Beach, VA and Milwaukee, WI have kept rent growth at a modest 1.4%, clocking in at $1,177 and $1,140, respectively. Lexington, KY and New Orleans, LA had the fourth- and fifth-slowest rent growth, both having posted 1.5% increases. Apartments for rent in Lexington now ask $887 per month on average, while New Orleans apartments go for $1,118 as of October.
SMALL CITIES: Four small cities saw rent increases above 10% in October
As expected, the largest proportional changes were seen in small cities. The astonishing rents growth figures in Odessa and Midland literally run rings around everyone else at the moment, both having registered more than twice as fast increases as any other U.S. city. Reno, Peoria and Lancaster, ranked 3rd, 4th and 5th among cities of similar size may also be familiar from the nationwide top.
Similarly, the bottom of the list, with the slowest growing rents were also in the extreme low in the nationwide ranking, is also almost exactly identical to the list discussed above – other than Waco, TX having taken Queens’ place with a 0.4% decrease.

Those renting apartments in Manhattan pay the highest rent in the U.S., $4,181 per month, followed by renters in San Francisco, where the average rent is now $3,609, and those in Boston, with an average apartment rent of $3,294. The cheapest rents are in Wichita KS, averaging $641, Tulsa, OK ($684) and Brownsville, TX ($687 per month).
Top 10 Highest Rents in October 2018
| City | State | Average Rent |
|---|---|---|
| Manhattan | NY | $4,181 |
| San Francisco | CA | $3,609 |
| Boston | MA | $3,294 |
| San Mateo | CA | $3,228 |
| Cambridge | MA | $3,079 |
| Sunnyvale | CA | $2,911 |
| Jersey City | NJ | $2,901 |
| Santa Clara | CA | $2,867 |
| Brooklyn | NY | $2,769 |
| San Jose | CA | $2,735 |
Top 10 Lowest Rents in October 2018
| City | State | Average Rent |
|---|---|---|
| Wichita | KS | $641 |
| Tulsa | OK | $684 |
| Brownsville | TX | $687 |
| Toledo | OH | $708 |
| Killeen | TX | $713 |
| Independence | MO | $735 |
| Amarillo | TX | $736 |
| Dayton | OH | $742 |
| Oklahoma City | OK | $752 |
| Fort Wayne | IN | $756 |
Check the average price of rent in your city by using this interactive table:
| City | State | AverageRent | ChangeMoM | ChangeYoY |
|---|---|---|---|---|
| Honolulu | HI | $1,790 | 0.90% | - |
| Odessa | TX | $1,368 | 0.50% | 25.20% |
| Midland | TX | $1,553 | -0.50% | 23.30% |
| Reno | NV | $1,257 | -0.70% | 11.20% |
| Peoria | AZ | $1,139 | 1.20% | 10.70% |
| Lancaster | CA | $1,280 | -0.20% | 9.40% |
| Manchester | NH | $1,361 | 0.40% | 9.20% |
| San Bernardino | CA | $1,229 | 0.40% | 8.80% |
| Mesa | AZ | $977 | 0.30% | 8.70% |
| Scottsdale | AZ | $1,435 | 2.30% | 8.50% |
| Glendale | AZ | $940 | 0.30% | 8.40% |
| Henderson | NV | $1,245 | 0.60% | 8.40% |
| Chandler | AZ | $1,254 | 0.60% | 8.20% |
| Phoenix | AZ | $1,012 | 0.40% | 8.00% |
| Gainesville | FL | $1,243 | 0.90% | 7.80% |
| Las Vegas | NV | $1,040 | 0.70% | 7.80% |
| Boise | ID | $1,105 | 0.00% | 7.70% |
| Rialto | CA | $1,279 | 0.50% | 7.60% |
| Daly City | CA | $2,530 | -0.70% | 7.50% |
| Greeley | CO | $1,145 | 0.10% | 7.10% |
| Salt Lake City | UT | $1,193 | -0.10% | 7.10% |
| Arvada | CO | $1,416 | 1.10% | 6.90% |
| Orlando | FL | $1,394 | -0.30% | 6.90% |
| Jacksonville | FL | $1,061 | 0.60% | 6.80% |
| Huntington Beach | CA | $2,144 | 0.40% | 6.80% |
| Knoxville | TN | $1,019 | -0.10% | 6.70% |
| Salinas | CA | $1,665 | -0.80% | 6.70% |
| North Las Vegas | NV | $1,028 | 0.70% | 6.60% |
| Coral Springs | FL | $1,716 | 0.00% | 6.60% |
| Santa Clarita | CA | $1,923 | -0.10% | 6.50% |
| High Point | NC | $804 | -0.10% | 6.50% |
| Los Angeles | CA | $2,454 | 0.90% | 6.50% |
| Gilbert | AZ | $1,226 | 0.10% | 6.40% |
| Spokane | WA | $961 | 0.40% | 6.40% |
| Clearwater | FL | $1,184 | 0.30% | 6.40% |
| San Diego | CA | $2,184 | 0.20% | 6.30% |
| Tacoma | WA | $1,266 | 0.60% | 6.30% |
| Sacramento | CA | $1,365 | 0.60% | 6.20% |
| Victorville | CA | $1,098 | 0.90% | 6.20% |
| Westminster | CO | $1,476 | 0.10% | 6.20% |
| Torrance | CA | $1,907 | 0.60% | 6.20% |
| Paradise | NV | $864 | 0.70% | 6.10% |
| West Valley City | UT | $1,126 | -0.60% | 6.10% |
| Santa Clara | CA | $2,867 | -1.50% | 6.10% |
| Chattanooga | TN | $966 | -0.20% | 6.00% |
| Clovis | CA | $1,083 | 0.70% | 6.00% |
| El Cajon | CA | $1,519 | 0.40% | 5.90% |
| Tempe | AZ | $1,305 | 0.10% | 5.90% |
| Temecula | CA | $1,659 | 0.90% | 5.90% |
| Oceanside | CA | $1,791 | 0.20% | 5.90% |
| Tampa | FL | $1,294 | -0.20% | 5.80% |
| Fresno | CA | $1,042 | 0.50% | 5.80% |
| Long Beach | CA | $1,985 | 0.60% | 5.80% |
| Davie | FL | $1,751 | -0.10% | 5.70% |
| San Mateo | CA | $3,228 | -0.30% | 5.70% |
| Toledo | OH | $708 | 0.40% | 5.70% |
| Hayward | CA | $2,157 | 0.70% | 5.60% |
| Sunnyvale | CA | $2,911 | -1.20% | 5.60% |
| West Palm Beach | FL | $1,432 | -0.10% | 5.60% |
| Chula Vista | CA | $1,744 | 0.80% | 5.60% |
| Riverside | CA | $1,520 | 0.30% | 5.60% |
| Oxnard | CA | $1,925 | 0.80% | 5.50% |
| Fairfield | CA | $1,773 | 0.10% | 5.50% |
| Rancho Cucamonga | CA | $1,842 | -0.20% | 5.50% |
| Ontario | CA | $1,677 | -1.30% | 5.50% |
| West Jordan | UT | $1,138 | 0.00% | 5.50% |
| Nashville | TN | $1,344 | 1.00% | 5.40% |
| Pittsburgh | PA | $1,214 | -0.30% | 5.40% |
| Denver | CO | $1,608 | -0.20% | 5.40% |
| Garden Grove | CA | $1,732 | 1.40% | 5.40% |
| Savannah | GA | $1,063 | 0.10% | 5.40% |
| Grand Rapids | MI | $1,025 | 0.70% | 5.30% |
| Memphis | TN | $782 | 0.10% | 5.20% |
| Moreno Valley | CA | $1,454 | -0.60% | 5.20% |
| Fontana | CA | $1,276 | 0.50% | 5.20% |
| Salem | OR | $1,019 | 0.30% | 5.20% |
| Garland | TX | $1,028 | 1.10% | 5.10% |
| Wilmington | NC | $1,097 | 1.30% | 5.10% |
| Grand Prairie | TX | $1,086 | 0.40% | 5.00% |
| Tucson | AZ | $836 | 0.20% | 5.00% |
| Stockton | CA | $1,139 | 0.90% | 5.00% |
| Escondido | CA | $1,588 | 0.30% | 5.00% |
| Santa Rosa | CA | $1,972 | -0.90% | 4.90% |
| Fort Collins | CO | $1,509 | -0.50% | 4.90% |
| Lakeland | FL | $1,021 | 0.40% | 4.90% |
| Brandon | FL | $1,187 | -0.10% | 4.90% |
| Pomona | CA | $1,495 | -1.00% | 4.80% |
| Atlanta | GA | $1,423 | 0.60% | 4.80% |
| Gresham | OR | $1,272 | 0.60% | 4.80% |
| Chicago | IL | $1,894 | -0.60% | 4.80% |
| San Jose | CA | $2,735 | -0.40% | 4.70% |
| Richmond | VA | $1,064 | -0.40% | 4.70% |
| San Francisco | CA | $3,609 | -0.40% | 4.70% |
| Ventura | CA | $1,961 | -0.60% | 4.70% |
| Winston-Salem | NC | $832 | 0.70% | 4.70% |
| Modesto | CA | $1,194 | 1.10% | 4.60% |
| Kansas City | KS | $790 | -0.30% | 4.60% |
| Bakersfield | CA | $973 | 0.70% | 4.60% |
| Thornton | CO | $1,420 | 0.40% | 4.60% |
| Pasadena | CA | $2,547 | -0.30% | 4.60% |
| Glendale | CA | $2,502 | 0.60% | 4.60% |
| North Charleston | SC | $1,015 | 0.30% | 4.50% |
| Charleston | SC | $1,307 | 0.30% | 4.40% |
| Macon | GA | $814 | 0.00% | 4.40% |
| Arlington | TX | $1,011 | 0.20% | 4.30% |
| Simi Valley | CA | $1,982 | -0.70% | 4.30% |
| Renton | WA | $1,653 | -1.10% | 4.30% |
| West Covina | CA | $1,809 | 0.90% | 4.30% |
| Hialeah | FL | $1,352 | 0.30% | 4.20% |
| Sandy Springs | GA | $1,451 | 0.70% | 4.20% |
| Austin | TX | $1,363 | 0.40% | 4.20% |
| Lewisville | TX | $1,146 | 0.00% | 4.20% |
| Pembroke Pines | FL | $1,720 | -0.30% | 4.20% |
| Bellevue | WA | $2,171 | -1.70% | 4.20% |
| Eugene | OR | $1,302 | 0.00% | 4.20% |
| Fort Worth | TX | $1,084 | 0.20% | 4.10% |
| Vancouver | WA | $1,292 | 0.50% | 4.10% |
| Carrollton | TX | $1,194 | 0.10% | 4.10% |
| Syracuse | NY | $1,094 | 0.40% | 4.10% |
| Philadelphia | PA | $1,578 | 0.70% | 4.10% |
| Santa Ana | CA | $1,911 | 0.30% | 4.10% |
| Everett | WA | $1,409 | -1.20% | 4.10% |
| Greensboro | NC | $872 | -0.10% | 4.10% |
| Hollywood | FL | $1,439 | 0.00% | 4.00% |
| Raleigh | NC | $1,159 | -0.10% | 4.00% |
| El Paso | TX | $775 | 0.10% | 4.00% |
| Lansing | MI | $806 | -0.20% | 4.00% |
| Manhattan | NY | $4,181 | 0.30% | 4.00% |
| Elizabeth | NJ | $1,230 | 0.20% | 4.00% |
| Durham | NC | $1,126 | -0.30% | 4.00% |
| Kent | WA | $1,451 | -0.80% | 3.90% |
| Olathe | KS | $934 | -0.40% | 3.90% |
| Carlsbad | CA | $2,273 | -0.20% | 3.90% |
| Birmingham | AL | $968 | 0.50% | 3.90% |
| Anaheim | CA | $1,779 | 0.70% | 3.90% |
| Vista | CA | $1,759 | -0.20% | 3.80% |
| Indianapolis | IN | $849 | 0.40% | 3.80% |
| Detroit | MI | $1,042 | 0.80% | 3.80% |
| Fremont | CA | $2,419 | -0.60% | 3.70% |
| Denton | TX | $1,199 | 0.50% | 3.70% |
| Miami | FL | $1,678 | -0.10% | 3.70% |
| Minneapolis | MN | $1,539 | -0.50% | 3.70% |
| Columbus | OH | $909 | -0.40% | 3.60% |
| Costa Mesa | CA | $2,066 | 0.80% | 3.60% |
| Columbia | SC | $1,035 | 1.00% | 3.60% |
| Fullerton | CA | $1,872 | 0.70% | 3.50% |
| Pompano Beach | FL | $1,380 | -0.40% | 3.50% |
| Sterling Heights | MI | $920 | 0.20% | 3.50% |
| Lakewood | CO | $1,491 | 0.20% | 3.50% |
| Arlington | VA | $2,163 | -0.30% | 3.40% |
| Pasadena | TX | $873 | -0.10% | 3.40% |
| Orange | CA | $2,021 | 0.50% | 3.40% |
| Aurora | CO | $1,332 | -0.30% | 3.40% |
| Charlotte | NC | $1,183 | -0.60% | 3.30% |
| Fort Lauderdale | FL | $1,920 | 1.00% | 3.30% |
| Murfreesboro | TN | $1,102 | 0.20% | 3.30% |
| Rochester | NY | $1,015 | 0.60% | 3.30% |
| Cleveland | OH | $1,055 | 0.30% | 3.20% |
| Oakland | CA | $2,707 | 0.10% | 3.20% |
| Newport News | VA | $936 | 0.20% | 3.20% |
| Cary | NC | $1,167 | -0.20% | 3.20% |
| Metairie | LA | $919 | 0.50% | 3.10% |
| Alexandria | VA | $1,709 | -0.20% | 3.10% |
| Fort Wayne | IN | $756 | 0.50% | 3.10% |
| Roseville | CA | $1,649 | -0.40% | 3.10% |
| Mesquite | TX | $960 | 0.50% | 3.10% |
| Augusta | GA | $798 | -1.00% | 3.10% |
| Aurora | IL | $1,302 | -0.20% | 3.10% |
| Omaha | NE | $902 | 0.10% | 3.10% |
| San Antonio | TX | $1,013 | 0.30% | 3.10% |
| Concord | CA | $1,950 | 0.20% | 3.00% |
| Round Rock | TX | $1,148 | -0.10% | 3.00% |
| Lincoln | NE | $944 | 0.20% | 2.90% |
| Louisville | KY | $924 | -0.20% | 2.90% |
| Portland | OR | $1,499 | -0.70% | 2.90% |
| Warren | MI | $789 | 0.60% | 2.90% |
| Albuquerque | NM | $867 | 0.50% | 2.80% |
| Ann Arbor | MI | $1,504 | -0.20% | 2.80% |
| Thousand Oaks | CA | $2,101 | -0.80% | 2.70% |
| Yonkers | NY | $1,964 | -0.70% | 2.70% |
| Boulder | CO | $1,897 | -0.40% | 2.70% |
| South Bend | IN | $899 | 0.00% | 2.60% |
| Oklahoma City | OK | $752 | 0.70% | 2.60% |
| Seattle | WA | $2,048 | -0.80% | 2.60% |
| Miramar | FL | $1,830 | -0.40% | 2.50% |
| Dallas | TX | $1,181 | 0.00% | 2.50% |
| St. Louis | MO | $905 | 0.00% | 2.50% |
| Colorado Springs | CO | $1,117 | -0.20% | 2.50% |
| Killeen | TX | $713 | 0.40% | 2.40% |
| Murrieta | CA | $1,616 | 0.10% | 2.40% |
| Chesapeake | VA | $1,199 | 0.50% | 2.40% |
| Hillsboro | OR | $1,501 | -1.80% | 2.40% |
| Madison | WI | $1,220 | 0.20% | 2.30% |
| Corona | CA | $1,653 | -0.10% | 2.20% |
| Independence | MO | $735 | 0.00% | 2.20% |
| Brooklyn | NY | $2,769 | -0.80% | 2.20% |
| Irving | TX | $1,132 | 0.00% | 2.20% |
| Columbus | GA | $849 | 0.00% | 2.20% |
| Las Cruces | NM | $804 | -0.50% | 2.20% |
| Norfolk | VA | $1,058 | 0.10% | 2.10% |
| St. Petersburg | FL | $1,274 | 0.00% | 2.10% |
| Dayton | OH | $742 | 0.10% | 2.10% |
| Burbank | CA | $2,257 | 0.40% | 2.00% |
| Lubbock | TX | $907 | 0.40% | 2.00% |
| Cincinnati | OH | $965 | 0.20% | 2.00% |
| Vallejo | CA | $1,741 | -0.50% | 2.00% |
| Corpus Christi | TX | $975 | 0.10% | 2.00% |
| Jersey City | NJ | $2,901 | 0.00% | 2.00% |
| Cambridge | MA | $3,079 | -0.90% | 1.90% |
| Mobile | AL | $798 | 0.30% | 1.90% |
| Jackson | MS | $773 | 0.40% | 1.80% |
| Houston | TX | $1,091 | -0.30% | 1.80% |
| Tallahassee | FL | $1,189 | 0.80% | 1.70% |
| Edison | NJ | $1,583 | 0.60% | 1.60% |
| Santa Maria | CA | $1,535 | -1.00% | 1.60% |
| Wichita | KS | $641 | 0.20% | 1.60% |
| Kansas City | MO | $964 | 0.00% | 1.60% |
| Buffalo | NY | $1,048 | 0.40% | 1.60% |
| New Orleans | LA | $1,118 | -0.50% | 1.50% |
| Lexington | KY | $887 | -0.20% | 1.50% |
| New Haven | CT | $1,657 | 1.00% | 1.50% |
| Milwaukee | WI | $1,140 | -0.40% | 1.40% |
| Washington | DC | $2,140 | -0.30% | 1.40% |
| Waterbury | CT | $933 | -0.20% | 1.40% |
| Virginia Beach | VA | $1,177 | 0.00% | 1.40% |
| Hampton | VA | $1,012 | -0.20% | 1.30% |
| Amarillo | TX | $736 | -0.10% | 1.20% |
| Plano | TX | $1,276 | -0.20% | 1.20% |
| McAllen | TX | $773 | -0.40% | 1.20% |
| Little Rock | AR | $778 | -0.10% | 1.20% |
| Overland Park | KS | $1,055 | -0.20% | 1.20% |
| Boston | MA | $3,294 | -1.50% | 1.00% |
| Tulsa | OK | $684 | 0.10% | 1.00% |
| Baltimore | MD | $1,252 | 0.20% | 1.00% |
| Newark | NJ | $1,162 | 0.20% | 1.00% |
| Naperville | IL | $1,437 | -1.80% | 0.90% |
| McKinney | TX | $1,233 | -0.30% | 0.80% |
| Broken Arrow | OK | $807 | 0.10% | 0.70% |
| Frisco | TX | $1,336 | 0.20% | 0.50% |
| Des Moines | IA | $886 | 0.30% | 0.50% |
| Akron | OH | $822 | 0.10% | 0.20% |
| Pearland | TX | $1,273 | -0.50% | 0.20% |
| Hartford | CT | $1,185 | -0.80% | 0.20% |
| Irvine | CA | $2,395 | 0.60% | 0.00% |
| Richardson | TX | $1,314 | 0.30% | 0.00% |
| Brownsville | TX | $687 | -0.10% | 0.00% |
| Waco | TX | $951 | 0.30% | -0.40% |
| Stamford | CT | $2,374 | -0.10% | -0.40% |
| Norman | OK | $876 | -0.30% | -0.60% |
| Queens | NY | $2,242 | 0.50% | -0.90% |
| College Station | TX | $1,188 | 0.20% | -1.60% |
| Baton Rouge | LA | $1,032 | -0.20% | -2.10% |
[mailmunch-form id=”583374″]
Methodology:
RentCafe is a nationwide apartment search website that enables renters to easily find apartments and houses for rent throughout the United States.
To compile this report, RentCafe’s research team analyzed rent data across the 252 largest cities in the US. The report is exclusively based on apartment data related to buildings containing 50 or more units. Our report includes cities with populations over 100,000 and a rental stock of at least 2,900 apartments in 50+ unit buildings.
In this report, large cities are cities with a population of 600,000 people or more, mid-sized cities are cities with a population between 300,000 and 600,000, and small cities are cities with a population of less than 300,000.
Rent data was provided by Yardi Matrix, a business development and asset management tool for brokers, sponsors, banks and equity sources underwriting investments in the multifamily, office, industrial and self-storage sectors. Rental rate coverage is for Market Rate properties only. Fully Affordable properties are not included in the Yardi Matrix rental surveys and are not reported in rental rate averages.
Starting with the January 2017 rent survey, Yardi Matrix is using a methodology that incorporates more properties into the sample which caused slight changes in overall rents and year-over-year changes compared to the previous reports. We expect this methodology adjustment to produce more accurate averages at the national and metro levels.
*National averages include over 130 markets across the U.S., as reported by Yardi Matrix.
Fair use and redistribution
We encourage you and freely grant you permission to reuse, host, or repost the images in this article. When doing so, we only ask that you kindly attribute the authors by linking to RentCafe.com or this page, so that your readers can learn more about this project, the research behind it and its methodology.
Share this article:

Balazs Szekely
Balazs Szekely, our Senior Creative Writer has a degree in journalism and dynamic career experience spanning radio, print and online media, as well as B2B and B2C copywriting. With extensive experience at several real estate industry publications, he’s well-versed in coworking trends, remote work, lifestyle and health topics. Balazs’ work has been featured in The New York Times, The Washington Post, and The Wall Street Journal, as well as on CBS, CNBC and more. He’s fascinated by photography, winter sports and nature, and, in his free time, you may find him away from home on a city break. You can drop Balazs a line via email.
Sign up for The Ready Renter newsletter
Get our free apartment hunting guide — plus tips, trends and research.
")

")

Related posts

Your first month of solo apartment life: A week-by-week guide for new renters
Moving into your own apartment is one of the most exciting milestones of young adulthood. But it’s also one of the most overwhelming. Between setting…

5 questions to ask before renting an apartment in Asheville, NC
Asheville has earned its reputation for good reason. The food scene punches well above its weight, the Blue Ridge Mountains are a short drive away…

June 2026 self storage report: Rents slip 1.5% annually, edge up 0.7% from May
National street rates averaged $135 in June 2026, down 1.5% year-over-year but up 0.7% from May, as the summer moving season provides a modest seasonal…
Subscribe to
The Ready Renter newsletter


