Share this article:


- The national average rent reached $1,430/month in March 2019, a year-over-year increase of 3.2%, according to data from Yardi Matrix.
- Trenton, NJ renters saw the highest annual rent increase in March, reaching $1,118 per month.
- Among the state’s largest cities, Jersey City apartments are the most expensive, while apartments in Trenton have the cheapest rents.
The early beginning of the rental season saw rent prices increase by 3.2% over the year — the lowest annual growth we’ve seen in more than 6 months. Compared to last year’s figure, the March average national rent of $1,430/month is $44 higher. Month-over-month, however, we witnessed a 0.3% rise, or $4 more added to average rent prices. This is consistent to last spring’s growth levels, signaling the end of the sluggish winter season.
Renting in New Jersey’s large cities in March 2019
The average rent in New Jersey’s largest cities is generally lower than the national average rent. The fastest growing rents in March were in Trenton, where rental apartment prices increased by 5.6% over the year, but have stagnated since the end of February. Hamilton apartments saw the second highest annual increase, jumping by 5.4%, $71 more expensive than the same month last year. On the other hand, the fastest year-over-year decrease in rent has been registered in Edison by 1.1%.
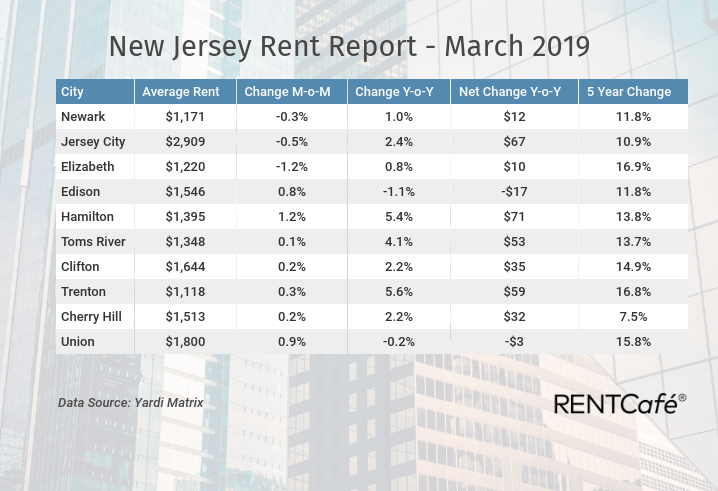
Of the large cities analyzed, Jersey City apartments are the state’s most expensive for renters, with an average rent of $2,909, followed by apartments in Union, where the average monthly rent is $1,800. On the other hand, the cheapest large city to rent an apartment, of the cities analyzed is Trenton, with an average apartment rent of $1,118.
Renting in New Jersey’s small cities in March 2019
Small cities in New Jersey follow the national trend, by displaying the fastest rent increases in their state. Maple Shade witnessed a 6.8% year-over-year rent growth, closely followed by Orange City, where apartments are 6% more expensive to rent than a year ago.
By far, the most expensive apartments in the state are in Hoboken, with an average rent of $3,463. The runner up is Edgewater ($3,160), followed by Jersey City, with a $2,909 average per month.
| City | Average Rent | Change M-o-M | Change Y-o-Y | Net Change Y-o-Y | 5 Year Change |
|---|---|---|---|---|---|
| Maple Shade | $1,203 | -0.1% | 6.8% | $77 | 13.4% |
| Orange | $1,276 | -0.5% | 6.0% | $72 | 26.6% |
| Trenton | $1,118 | 0.3% | 5.6% | $59 | 16.8% |
| Morristown | $2,202 | 0.2% | 5.5% | $115 | 16.5% |
| East Orange | $1,262 | -0.7% | 5.4% | $65 | 19.2% |
| Hamilton | $1,395 | 1.2% | 5.4% | $71 | 13.8% |
| Ewing | $1,580 | 0.1% | 5.0% | $75 | 16.2% |
| Lindenwold | $969 | 0.5% | 4.8% | $44 | 11.8% |
| Blackwood | $1,115 | -1.8% | 4.7% | $50 | 13.4% |
| Irvington | $944 | -0.6% | 4.4% | $40 | 16.1% |
| Toms River | $1,348 | 0.1% | 4.1% | $53 | 13.7% |
| Lakewood | $1,294 | 0.6% | 3.7% | $46 | 13.9% |
| Hoboken | $3,463 | -0.2% | 3.2% | $106 | 9.7% |
| Bloomfield | $1,631 | 0.1% | 3.0% | $48 | 19.3% |
| Old Bridge | $1,346 | 0.2% | 2.9% | $38 | 13.2% |
| Hackensack | $1,790 | 0.4% | 2.9% | $50 | 17.2% |
| West New York | $2,527 | -0.2% | 2.8% | $70 | 4.4% |
| New Brunswick | $1,804 | 0.1% | 2.5% | $44 | 15.3% |
| Jersey City | $2,909 | -0.5% | 2.4% | $67 | 10.9% |
| Hackettstown | $1,179 | -2.4% | 2.3% | $27 | n/a |
| Clifton | $1,644 | 0.2% | 2.2% | $35 | 14.9% |
| Cherry Hill | $1,513 | 0.2% | 2.2% | $32 | 7.5% |
| Voorhees | $1,357 | -0.9% | 2.1% | $28 | 6.4% |
| Parsippany | $1,499 | 0.3% | 1.8% | $26 | 18.1% |
| Marlton | $1,443 | 0.0% | 1.3% | $18 | 9.7% |
| Newark | $1,171 | -0.3% | 1.0% | $12 | 11.8% |
| North Brunswick | $1,608 | 0.0% | 0.9% | $14 | 14.2% |
| Elizabeth | $1,220 | -1.2% | 0.8% | $10 | 16.9% |
| New Milford | $1,371 | 0.1% | 0.7% | $10 | 11.9% |
| Piscataway | $1,622 | -0.7% | 0.1% | $2 | 9.1% |
| Union | $1,800 | 0.9% | -0.2% | -$3 | 15.8% |
| Somerset | $1,683 | -0.6% | -0.3% | -$5 | 14.7% |
| Plainsboro | $1,464 | 0.2% | -0.9% | -$14 | 15.7% |
| Edison | $1,546 | 0.8% | -1.1% | -$17 | 11.8% |
| Edgewater | $3,160 | -0.2% | -2.0% | -$66 | 5.2% |
| Fort Lee | $2,521 | 0.0% | -2.3% | -$59 | 7.0% |
Methodology
RentCafe is a nationwide apartment search website that enables renters to easily find apartments and houses for rent throughout the United States.
To prepare the state rent report, we analyzed only cities with a rental stock of at least 2,000 apartments in 50+ unit buildings. To compile the national rent report, RentCafe’s research team analyzed rent data across the 253 largest cities in the U.S., in large-scale apartment buildings with 50 or more units.
Rent data was provided by Yardi Matrix, a business development and asset management tool for brokers, sponsors, banks and equity sources underwriting investments in the multifamily, office, industrial and self-storage sectors. Rental rate coverage is for Market Rate properties only. Fully Affordable properties are not included in the Yardi Matrix rental surveys and are not reported in rental rate averages.
Fair use and redistribution
We encourage you and freely grant you permission to reuse, host, or repost the images in this article. When doing so, we only ask that you kindly attribute the authors by linking to RentCafe.com or this page, so that your readers can learn more about this project, the research behind it and its methodology.
Share this article:


Alexandra Ciuntu
Alexandra is a creative writer and researcher for RentCafe. With a background in e-learning content writing and a passion for knowledge-sharing platforms, she's covered topics from prop-tech to renters insurance to interior design tips. Very familiar with the renter lifestyle herself, Alexandra enjoys researching and writing about renter demographic shifts and residential real estate market trends as much as she loves writing about how to get along with roommates. You can connect with Alexandra via email.
Alexandra’s work includes collaborations with financial and business publications. Her articles have been featured in several national and international online publications, including the New York Times, Barrons, Inman, Forbes, Architectural Digest, Marketwatch, Bisnow, and Curbed. Her educational background includes a B.A. in Japanese and English and an M.A. in Journalism and Cultural Studies.
Sign up for The Ready Renter newsletter
Get our free apartment hunting guide — plus tips, trends and research.




Related posts
Detroit vs Chicago: Which Midwest city is more affordable for renters?
Detroit and Chicago are about 280 miles apart, making a move between the two a realistic option for many Midwestern renters. Maybe you’ve landed a…
Public transit options for renters in Newark, NJ: How to get around without a car
Newark renters can live car-free using PATH, NJ Transit rail, the Newark Light Rail and an extensive bus network, with Manhattan reachable in about 20…
San Diego vs. Los Angeles: Which city fits your renter budget?
Los Angeles and San Diego share a coastline, a climate and a reputation for expensive rent, but the day-to-day cost of living in each city…
Subscribe to
The Ready Renter newsletter