Apartment Rents Stabilize in November Around the Country, While Mid-Sized Markets Remain Active
Share this article:
Key takeaways:
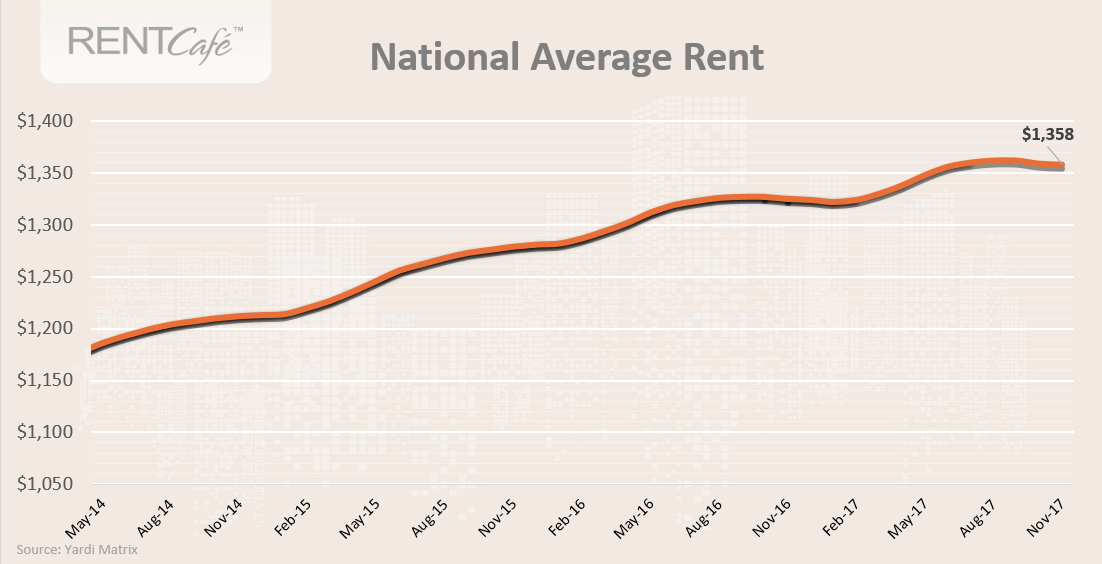
- Rents were consistent for the month, coming in at $1,358 – just 2.5 percent higher than this time last year, according to data from Yardi Matrix.
- 83% of the nation’s biggest cities have seen rents grow in the last year, 14% saw rents remain steady, while only 3% experienced rent drops compared to 2016.
- America’s smaller cities are continuing to see the biggest price increases y-o-y, with the Lone Star State’s Odessa and Midland leading the pack.
- Month-over-month rents are down across all sized units, including studios, one-bedrooms, two-bedrooms, and three-bedrooms.
Stability was the name of the game in November, with not only the national rent staying stable, but also the rents of the nation’s most volatile markets. Whether it’s a result of the renting off-season or a sign of changing tides is yet to be seen. It may take a few more months until we have an answer.
Rent is slightly down across all unit sizes for the month, but still up compared to last year
Rents are down for all sized apartments – at least month over month. Since October, studio apartments, one-bedrooms, two-bedrooms, and three-bedrooms have all dipped 0.1 percent. Seeing that two unit sizes saw rents either rise or stay steady back in October, this is good news for renters of all budgets.
Over the year, rents have risen on all four unit sizes, though not drastically. Studios have grown the least since 2016, rising 2.4 percent to $1,196 per month. Three-bedroom rents grew by 2.7 percent ($1,332), two-bedroom rents up 2.9 percent ($1,332), and prices for one-bedrooms increased by a full 3 percent year over year ($1,166).
| Bedroom Type | Average Rent | Change M-o-M | Change Y-o-Y |
|---|---|---|---|
| Studio | $1,196 | -0.1% | 2.4% |
| 1 Bed | $1,166 | -0.1% | 3.0% |
| 2 Beds | $1,332 | -0.1% | 2.9% |
| 3 Beds | $1,560 | -0.1% | 2.7% |
Rents in trendsetter markets are going down or growing slower than the national average
Renters in nine of the nation’s 250 biggest cities are in luck; rents are down – in some cities as much as 7.7 percent over the year. Lubbock, TX rents have dropped the most since 2016, falling nearly 8 percent to just $891 per month. Fellow southern towns Norman, OK and McAllen, TX also saw rent drops of 2.6 percent and 2.3 percent, respectively. Rents in McAllen were just $761 per month in November.
Apartment rents in many large cities such as Chicago, Atlanta, Houston, Boston, Philadelphia, Miami, Washington DC, San Francisco, Austin and other markets of similar size have increased by less than the national average year over year. In some spots they’re even falling — in two of New York City’s most populated boroughs (Brooklyn and Manhattan), as well as in hot market Portland. On the other hand, a few big markets remain strong. In Los Angeles, Seattle, and Fort Worth rents climbed by over 5% over the year.
Other cities to see rents drop in November were New Orleans; Kansas City, KS; and Amarillo, TX. Nearly twice as many cities as last month saw rents decline.
U.S. Cities Where Rents Decreased Y-o-Y in November 2017
| # | City | State | Change Y-o-Y | Average Rent |
|---|---|---|---|---|
| 1 | Lubbock | TX | -7.7% | $891 |
| 2 | Norman | OK | -2.6% | $857 |
| 3 | McAllen | TX | -2.3% | $761 |
| 4 | Brooklyn (New York City) | NY | -2.0% | $2,695 |
| 5 | Manhattan (New York City) | NY | -1.9% | $4,089 |
| 6 | New Orleans | LA | -1.4% | $1,085 |
| 7 | Portland | OR | -1.2% | $1,431 |
| 8 | Kansas City | KS | -1.2% | $754 |
| 9 | Amarillo | TX | -1.1% | $724 |
Small Texas towns lead the pack when it comes to rent growth
Apartments in Texas oil and gas towns Midland and Odessa continue to get pricier in November in a sustained rally to recover after the local market reached a low in 2016. Odessa came in with rents of $1,111 last month – a whopping 33.2 percent higher than last year’s numbers. Midland rents jumped 25.6 percent over the year, hitting $1,274 for the month.
The rest of the fastest-growing rents list is dominated by cities in the West and Northeast, with California claiming five of the remaining spots. Buffalo, NY rents rose 11.4 percent over the last year, while Yonkers, NY rents increased 10.4 percent. Lancaster, Sacramento, Modesto, Victorville and Ventura, CA all saw rents rise nearly 8 percent or higher. Insufficient rental supply and weak construction activity are the common denominators in these markets.
U.S. Cities with the Fastest Growing Rents in November 2017
| # | City | State | Change Y-o-Y | Average Rent |
|---|---|---|---|---|
| 1 | Odessa | TX | 33.2% | $1,111 |
| 2 | Midland | TX | 25.6% | $1,274 |
| 3 | Buffalo | NY | 11.4% | $1,017 |
| 4 | Lancaster | CA | 11.2% | $1,167 |
| 5 | Yonkers | NY | 10.4% | $1,909 |
| 6 | Reno | NV | 9.9% | $1,121 |
| 7 | Sacramento | CA | 9.1% | $1,289 |
| 8 | Modesto | CA | 8.6% | $1,146 |
| 9 | Victorville | CA | 8.1% | $1,037 |
| 10 | Ventura | CA | 7.9% | $1,866 |
West Coast, Northeast remain highest-priced markets, while Midwest acts affordably
As the nation’s most expensive markets are absorbing the new apartments delivered this year, prices stayed the same for November, though many actually saw rents decrease over the month – if ever so slightly. Manhattan claimed the No. 1 spot, with the country’s highest rent of $4,089 – nearly $700 more than the No. 2-ranked San Francisco. Bay Area residents pay just over $3,400 a month.
Massachusetts’ biggest markets – Boston and Cambridge – once again took the No. 3 and 4 spots, with rents of $3,262 and $3,037, respectively. (Though if you look at Massachusetts’ highest-rent ZIP codes, these rents are a steal.)
Likely to no one’s surprise, five California cities made the list, including San Mateo, Sunnyvale, Santa Clara and San Jose, while two Northeasterly towns – Jersey City and Brooklyn — rounded out the remaining top 10.
On the opposite end of the spectrum, you have Wichita, KS, where rents are nearly seven times less than those in costly Manhattan. Toledo, OH rents aren’t far behind either, coming in at $667 for the month. The two have dominated the nation’s lowest rents list for some time now.
Other low-cost areas are spread across the South and Midwest. Three Texas towns – Brownsville, Killeen and Amarillo – made the list, while metros in Oklahoma, Missouri, Indiana and Ohio filled out the rest. Tulsa, OK took the No. 3 spot with rents of just $680 in November.
Top 10 Cities with the Highest Rents - November 2017
| City | State | Average Rent |
|---|---|---|
| Manhattan | NY | $4,089 |
| San Francisco | CA | $3,432 |
| Boston | MA | $3,262 |
| Cambridge | MA | $3,037 |
| San Mateo | CA | $3,021 |
| Jersey City | NJ | $2,822 |
| Sunnyvale | CA | $2,735 |
| Brooklyn | NY | $2,695 |
| Santa Clara | CA | $2,692 |
| San Jose | CA | $2,608 |
Top 10 Cities with the Lowest Rents - November 2017
| City | State | Average Rent |
|---|---|---|
| Wichita | KS | $631 |
| Toledo | OH | $667 |
| Tulsa | OK | $679 |
| Brownsville | TX | $691 |
| Killeen | TX | $695 |
| Independence | MO | $719 |
| Fort Wayne | IN | $723 |
| Amarillo | TX | $724 |
| Oklahoma City | OK | $728 |
| Dayton | OH | $730 |
Urban cores see rents stabilize – or at least come close to it
It seems America’s most volatile markets – largely urban centers located in the West and Northeast – are finally settling down. Though Manhattan’s sky-high rents remain the country’s most expensive month after month, they’ve actually dipped over the year – and they stayed steady from October to November.
San Francisco rents rose just 0.2 percent over the month and only 1.1 percent for the year. Similar stories ring true for Boston, Cambridge, and Brooklyn, where rents rose incrementally over the year and little to none for the month.
Many of the nation’s more hyperactive markets even saw declines in November. In Sunnyvale, CA, for example, rents fell nearly a full percent over the month (though they rose 5 percent since 2016). Rents also dropped in volatile San Mateo, San Jose and Santa Clara, CA, as well as Jersey City, NJ.
Yardi Matrix Senior Analyst Doug Ressler explains some of the factors that have an influence on rent prices this year and in the following year: “Multifamily remains the strongest sector by a variety of metrics, including investment sales volume, and analysts expect a deceleration in rent growth as the markets absorb new supply. Housing demographics continue to favor renting with a continued robust delivery pipeline. Yardi-Matrix notes that 300,000 apartment units are expected to come online for 2017 and 360,000 in 2018. This amount of new supply exceeds previous national levels over the last twenty years. Thirty-one percent of those new apartments will be delivered in the South Atlantic, followed by 25% in the West and 19% in the South West. The Northeast and Midwest will round it out with 14% and 12%.”
Check out the average price of rent in your city by using this interactive table:
| City | State | Average Rent | Change M-o-M | Change Y-o-Y |
|---|---|---|---|---|
| Manhattan (New York City) | NY | $4,089 | 0.00% | -1.90% |
| San Francisco | CA | $3,432 | 0.20% | 1.10% |
| Boston | MA | $3,262 | 0.00% | 2.00% |
| Cambridge | MA | $3,037 | 0.10% | 1.30% |
| San Mateo | CA | $3,021 | -0.10% | 1.00% |
| Jersey City | NJ | $2,822 | -0.10% | 1.80% |
| Sunnyvale | CA | $2,735 | -0.80% | 5.00% |
| Brooklyn (New York City) | NY | $2,695 | 0.00% | -2.00% |
| Santa Clara | CA | $2,692 | -0.40% | 2.70% |
| San Jose | CA | $2,608 | -0.50% | 2.20% |
| Oakland | CA | $2,525 | -0.50% | 1.80% |
| Daly City | CA | $2,485 | 0.00% | 4.10% |
| Irvine | CA | $2,401 | 0.30% | 3.90% |
| Glendale | CA | $2,393 | 0.00% | 3.30% |
| Stamford | CT | $2,388 | 0.90% | 0.90% |
| Pasadena | CA | $2,380 | -0.50% | 3.30% |
| Fremont | CA | $2,330 | -0.10% | 1.30% |
| Los Angeles | CA | $2,285 | -0.30% | 5.20% |
| Burbank | CA | $2,210 | -0.10% | 5.50% |
| Carlsbad | CA | $2,169 | -0.30% | 3.80% |
| Washington | DC | $2,090 | -0.10% | 1.40% |
| Arlington | VA | $2,058 | -0.20% | -0.40% |
| Thousand Oaks | CA | $2,052 | 0.10% | 6.60% |
| Bellevue | WA | $2,048 | -0.90% | 0.60% |
| San Diego | CA | $2,045 | 1.10% | 4.00% |
| Hayward | CA | $2,033 | -0.10% | 2.90% |
| Huntington Beach | CA | $2,007 | 0.00% | 2.80% |
| Costa Mesa | CA | $1,998 | 0.20% | 2.80% |
| Seattle | WA | $1,977 | -0.60% | 5.10% |
| Orange | CA | $1,953 | -0.10% | -0.70% |
| Yonkers | NY | $1,909 | 0.10% | 10.40% |
| Simi Valley | CA | $1,904 | 0.10% | 1.00% |
| Concord | CA | $1,883 | 0.00% | 3.50% |
| Long Beach | CA | $1,871 | -0.30% | 2.40% |
| Ventura | CA | $1,866 | -0.10% | 7.90% |
| Santa Rosa | CA | $1,848 | 0.00% | 4.60% |
| Santa Ana | CA | $1,836 | 0.20% | 3.90% |
| Santa Clarita | CA | $1,830 | 0.80% | 1.40% |
| Boulder | CO | $1,825 | -0.40% | 5.60% |
| Oxnard | CA | $1,820 | -0.20% | 4.20% |
| Fort Lauderdale | FL | $1,817 | -0.10% | 6.60% |
| Fullerton | CA | $1,803 | -0.10% | 4.00% |
| Miramar | FL | $1,799 | 0.50% | 1.50% |
| Chicago | IL | $1,790 | -0.30% | 2.50% |
| Torrance | CA | $1,777 | -0.30% | 5.10% |
| Rancho Cucamonga | CA | $1,742 | -0.20% | 3.10% |
| Anaheim | CA | $1,719 | -0.10% | 4.80% |
| West Covina | CA | $1,718 | -1.00% | 7.80% |
| Vallejo | CA | $1,706 | -0.20% | 4.90% |
| Fairfield | CA | $1,692 | 0.10% | 7.20% |
| Oceanside | CA | $1,687 | -0.40% | 3.90% |
| Vista | CA | $1,687 | -0.20% | 4.10% |
| Davie | FL | $1,653 | 0.30% | -0.50% |
| Alexandria | VA | $1,652 | -0.40% | -0.80% |
| Garden Grove | CA | $1,644 | 0.10% | 3.20% |
| New Haven | CT | $1,643 | 0.70% | 5.10% |
| Chula Vista | CA | $1,635 | -0.10% | 5.30% |
| Corona | CA | $1,625 | 0.50% | 6.40% |
| Coral Springs | FL | $1,613 | 0.60% | -0.50% |
| Pembroke Pines | FL | $1,612 | 0.70% | 2.40% |
| Murrieta | CA | $1,597 | -0.20% | 4.60% |
| Miami | FL | $1,596 | -0.30% | 1.40% |
| Roseville | CA | $1,592 | -0.40% | 5.20% |
| Ontario | CA | $1,581 | 0.10% | 2.60% |
| Renton | WA | $1,574 | -0.60% | 4.90% |
| Temecula | CA | $1,563 | -0.30% | 4.30% |
| Edison | NJ | $1,559 | 0.10% | 4.20% |
| Salinas | CA | $1,545 | -0.60% | 5.80% |
| Santa Maria | CA | $1,519 | 0.50% | 6.30% |
| Denver | CO | $1,511 | -0.40% | 3.20% |
| Escondido | CA | $1,504 | -0.60% | 5.40% |
| Philadelphia | PA | $1,497 | -0.20% | 1.90% |
| Hillsboro | OR | $1,470 | -0.40% | 0.80% |
| Minneapolis | MN | $1,470 | -0.30% | 3.20% |
| Ann Arbor | MI | $1,469 | 0.40% | 4.90% |
| Riverside | CA | $1,441 | 0.10% | 5.70% |
| Naperville | IL | $1,437 | 0.80% | 2.40% |
| Pomona | CA | $1,433 | 0.10% | 0.80% |
| Portland | OR | $1,431 | -0.70% | -1.20% |
| Fort Collins | CO | $1,426 | -0.20% | 5.60% |
| El Cajon | CA | $1,422 | -0.10% | 4.30% |
| Lakewood | CO | $1,408 | -0.90% | 3.20% |
| Sandy Springs | GA | $1,388 | -0.30% | 2.70% |
| Moreno Valley | CA | $1,383 | 0.30% | 4.00% |
| Kent | WA | $1,380 | -0.70% | 6.00% |
| Westminster | CO | $1,377 | -0.70% | 2.50% |
| West Palm Beach | FL | $1,352 | 1.00% | 5.50% |
| Thornton | CO | $1,350 | -0.70% | 2.70% |
| Atlanta | GA | $1,344 | -0.60% | 2.40% |
| Everett | WA | $1,342 | -0.90% | 3.20% |
| Pompano Beach | FL | $1,335 | 0.10% | 4.70% |
| Frisco | TX | $1,332 | 0.30% | 2.40% |
| Scottsdale | AZ | $1,331 | 0.80% | 5.20% |
| Richardson | TX | $1,325 | 0.50% | 2.20% |
| Hollywood | FL | $1,319 | 1.00% | 2.30% |
| Arvada | CO | $1,317 | -0.40% | 6.00% |
| Orlando | FL | $1,304 | 0.00% | 5.80% |
| Austin | TX | $1,300 | -0.20% | 0.00% |
| Sacramento | CA | $1,289 | 0.30% | 9.10% |
| Aurora | CO | $1,280 | -0.50% | 5.40% |
| Midland | TX | $1,274 | 1.80% | 25.60% |
| Pearland | TX | $1,272 | 0.20% | 1.60% |
| Aurora | IL | $1,271 | 0.50% | 0.60% |
| Hialeah | FL | $1,265 | 0.20% | 4.00% |
| Nashville | TN | $1,263 | 0.00% | 1.50% |
| Plano | TX | $1,261 | 0.50% | 1.00% |
| Manchester | NH | $1,244 | -0.30% | 2.60% |
| Eugene | OR | $1,243 | -0.40% | 3.10% |
| Tempe | AZ | $1,234 | 0.20% | 3.80% |
| Baltimore | MD | $1,234 | -0.20% | 4.40% |
| St. Petersburg | FL | $1,233 | -0.30% | 6.60% |
| Vancouver | WA | $1,230 | -0.30% | 4.20% |
| Charleston | SC | $1,223 | -1.30% | -0.20% |
| McKinney | TX | $1,222 | 0.50% | 1.80% |
| Fontana | CA | $1,216 | 0.30% | 6.90% |
| Gresham | OR | $1,209 | -0.30% | 1.60% |
| Tampa | FL | $1,207 | 0.00% | 3.30% |
| College Station | TX | $1,199 | -0.80% | -0.20% |
| Hartford | CT | $1,197 | 1.20% | 3.50% |
| Rialto | CA | $1,189 | 0.10% | 4.70% |
| Madison | WI | $1,186 | 0.00% | 1.30% |
| Tacoma | WA | $1,186 | -0.30% | 7.30% |
| Elizabeth | NJ | $1,180 | 0.30% | 6.90% |
| Newark | NJ | $1,173 | 0.40% | 4.30% |
| Chandler | AZ | $1,167 | 0.40% | 6.60% |
| Lancaster | CA | $1,167 | 0.10% | 11.30% |
| Chesapeake | VA | $1,163 | 0.20% | 3.50% |
| Tallahassee | FL | $1,159 | 0.10% | 2.90% |
| Gainesville | FL | $1,158 | 0.30% | 3.60% |
| Virginia Beach | VA | $1,157 | -0.10% | 3.00% |
| Henderson | NV | $1,155 | 0.40% | 7.00% |
| Denton | TX | $1,151 | -0.50% | 2.00% |
| Charlotte | NC | $1,147 | 0.30% | 3.40% |
| Dallas | TX | $1,146 | 0.10% | 4.30% |
| Gilbert | AZ | $1,146 | 0.00% | 6.10% |
| Modesto | CA | $1,146 | 0.30% | 8.60% |
| Pittsburgh | PA | $1,143 | -0.80% | 1.70% |
| Carrollton | TX | $1,142 | 0.10% | 2.10% |
| Cary | NC | $1,135 | -0.20% | 2.30% |
| San Bernardino | CA | $1,132 | 0.10% | 5.70% |
| Brandon | FL | $1,131 | -0.20% | 2.40% |
| Reno | NV | $1,121 | 0.00% | 9.90% |
| Salt Lake City | UT | $1,115 | 0.30% | 4.70% |
| Round Rock | TX | $1,113 | -0.30% | -0.70% |
| Raleigh | NC | $1,112 | -0.10% | 2.30% |
| Odessa | TX | $1,111 | 1.60% | 33.20% |
| Clearwater | FL | $1,109 | -0.10% | 2.90% |
| Milwaukee | WI | $1,108 | -0.20% | 2.40% |
| Irving | TX | $1,102 | -0.30% | 4.00% |
| Lewisville | TX | $1,090 | -0.70% | -0.50% |
| West Jordan | UT | $1,088 | 0.50% | 3.50% |
| New Orleans | LA | $1,085 | -0.90% | -1.40% |
| Colorado Springs | CO | $1,075 | -0.70% | 6.40% |
| Stockton | CA | $1,073 | 0.20% | 7.10% |
| Durham | NC | $1,072 | -0.20% | 3.50% |
| West Valley City | UT | $1,072 | 1.00% | 4.40% |
| Houston | TX | $1,069 | 0.10% | 2.10% |
| Greeley | CO | $1,067 | -0.20% | 5.60% |
| Murfreesboro | TN | $1,065 | -0.20% | 2.70% |
| Syracuse | NY | $1,060 | 0.50% | 1.50% |
| Baton Rouge | LA | $1,049 | 0.00% | -0.90% |
| Fort Worth | TX | $1,044 | -0.10% | 5.40% |
| Wilmington | NC | $1,037 | -0.30% | 1.50% |
| Victorville | CA | $1,037 | 0.30% | 8.10% |
| Overland Park | KS | $1,034 | -0.40% | 2.40% |
| Norfolk | VA | $1,033 | -0.40% | 2.20% |
| Grand Prairie | TX | $1,030 | -0.30% | 4.90% |
| Peoria | AZ | $1,030 | 0.30% | 6.40% |
| Clovis | CA | $1,023 | 0.10% | 5.60% |
| Buffalo | NY | $1,017 | 0.30% | 11.40% |
| Richmond | VA | $1,016 | -0.20% | 3.80% |
| Cleveland | OH | $1,011 | -0.30% | 3.70% |
| Boise | ID | $1,010 | -0.40% | 5.10% |
| Savannah | GA | $1,009 | -0.20% | 1.80% |
| Columbia | SC | $1,000 | 0.20% | 4.00% |
| Detroit | MI | $996 | 0.40% | 6.20% |
| Jacksonville | FL | $994 | 0.30% | 5.30% |
| Hampton | VA | $993 | -0.60% | 1.70% |
| Fresno | CA | $986 | 0.20% | 6.40% |
| San Antonio | TX | $979 | 0.00% | 1.90% |
| Rochester | NY | $975 | 0.00% | 1.70% |
| Corpus Christi | TX | $974 | 0.70% | 2.10% |
| Lakeland | FL | $972 | -0.20% | 4.30% |
| North Las Vegas | NV | $968 | 0.40% | 7.10% |
| Las Vegas | NV | $966 | 0.40% | 6.60% |
| Salem | OR | $966 | -0.40% | 7.10% |
| North Charleston | SC | $963 | -0.80% | 0.50% |
| Garland | TX | $963 | 0.00% | 5.00% |
| Grand Rapids | MI | $962 | 0.00% | 4.10% |
| Arlington | TX | $961 | -0.20% | 6.00% |
| Knoxville | TN | $954 | -0.50% | 2.90% |
| Waco | TX | $944 | -0.50% | -0.80% |
| Kansas City | MO | $940 | 0.10% | 2.40% |
| Cincinnati | OH | $935 | -0.30% | 3.40% |
| Phoenix | AZ | $935 | 0.00% | 4.70% |
| Bakersfield | CA | $932 | 0.20% | 1.30% |
| Waterbury | CT | $922 | 0.90% | 1.90% |
| Mesquite | TX | $919 | -0.90% | 2.60% |
| Birmingham | AL | $918 | -0.70% | 4.10% |
| Lincoln | NE | $911 | -0.60% | 1.50% |
| Chattanooga | TN | $904 | -0.20% | 1.50% |
| Newport News | VA | $901 | -0.10% | 0.80% |
| Spokane | WA | $900 | 0.50% | 5.80% |
| South Bend | IN | $896 | 1.90% | 3.80% |
| Mesa | AZ | $894 | -0.10% | 4.00% |
| Lubbock | TX | $891 | 0.20% | -7.70% |
| Louisville | KY | $888 | -0.20% | 2.10% |
| Sterling Heights | MI | $888 | -0.10% | 5.30% |
| Metairie | LA | $887 | -0.50% | 0.60% |
| Olathe | KS | $887 | 0.00% | 3.10% |
| St. Louis | MO | $880 | 0.00% | 2.60% |
| Columbus | OH | $878 | 0.10% | 5.20% |
| Lexington | KY | $876 | 0.20% | 2.00% |
| Des Moines | IA | $872 | 0.40% | 6.70% |
| Omaha | NE | $865 | -0.50% | 1.70% |
| Glendale | AZ | $865 | -0.10% | 6.00% |
| Norman | OK | $857 | -1.20% | -2.60% |
| Pasadena | TX | $846 | 0.40% | 4.10% |
| Albuquerque | NM | $840 | -0.20% | 2.80% |
| Greensboro | NC | $839 | 0.00% | 3.30% |
| Paradise | NV | $830 | 0.50% | 5.20% |
| Columbus | GA | $828 | 0.40% | 0.40% |
| Akron | OH | $822 | -0.10% | 2.10% |
| Indianapolis | IN | $815 | -0.10% | 3.00% |
| Tucson | AZ | $799 | 0.40% | 4.90% |
| Broken Arrow | OK | $792 | -0.30% | -0.30% |
| Winston-Salem | NC | $792 | -0.30% | 5.30% |
| Las Cruces | NM | $785 | 0.00% | 0.80% |
| Macon | GA | $784 | 0.50% | 5.10% |
| Lansing | MI | $778 | 0.80% | 1.40% |
| Mobile | AL | $775 | 0.00% | 0.90% |
| Warren | MI | $773 | 0.40% | 3.20% |
| Little Rock | AR | $767 | -0.10% | 0.40% |
| Augusta | GA | $765 | 0.50% | 1.70% |
| McAllen | TX | $761 | -0.10% | -2.30% |
| Jackson | MS | $756 | -0.70% | 3.10% |
| Kansas City | KS | $754 | 0.10% | -1.20% |
| High Point | NC | $750 | -1.10% | 1.60% |
| El Paso | TX | $744 | -0.10% | 0.70% |
| Memphis | TN | $742 | -0.10% | 2.80% |
| Wichita | KS | $631 | 0.00% | 1.00% |
| Toledo | OH | $667 | -0.20% | 0.90% |
| Tulsa | OK | $679 | -0.20% | 0.70% |
| Brownsville | TX | $691 | 0.10% | 0.90% |
| Killeen | TX | $695 | -0.10% | 2.20% |
| Independence | MO | $719 | 0.10% | 1.80% |
| Fort Wayne | IN | $723 | -1.00% | 3.60% |
| Amarillo | TX | $724 | -0.60% | -1.10% |
| Oklahoma City | OK | $728 | -0.30% | 0.00% |
| Dayton | OH | $730 | -0.30% | 3.70% |
[mailmunch-form id=”583374″]
About RentCafe and How We Compiled the Data
RentCafe is a nationwide apartment search website that enables renters to easily find apartments and houses for rent throughout the United States.
To compile this report, RentCafe’s research team analyzed rent data across the 250 cities in the US. The report is exclusively based on apartment data related to buildings containing 50 or more units. Our report includes cities with populations over 100,000 and a rental stock of at least 2,900 apartments in 50+ unit buildings.
Rent data was provided by Yardi Matrix, a business development and asset management tool for brokers, sponsors, banks and equity sources underwriting investments in the multifamily, office, industrial and self-storage sectors. Rental rate coverage is for Market Rate properties only. Fully Affordable properties are not included in the Yardi Matrix rental surveys and are not reported in rental rate averages.
Starting with the January rent survey, Yardi Matrix is using a methodology that incorporates more properties into the sample which caused slight changes in overall rents and year-over-year changes compared to the previous reports. We expect this methodology adjustment to produce more accurate averages at the national and metro levels.
*National averages include 124 markets across the US, as reported by Yardi Matrix.
Share this article:

Nadia Balint
Nadia Balint is a senior creative writer for RENTCafé. She covers news and trends in residential and commercial real estate and their impact on our everyday life, including rental housing, for-sale housing, real estate development, homeownership, market reports, insurance, landlord-tenant laws, personal finance, urban development, economy, sustainability, and social issues. Nadia holds a B.S. in Business Management from Northeastern Illinois University in Chicago. You can connect with Nadia via email.
Nadia’s work and expertise have been quoted by major national and local media outlets, including CNN, CNBC, CBS News, Curbed, The NY Post, The Chicago Tribune, The Denver Post as well as industry publications, such as GlobeSt, Bisnow, Inman News, Multifamily Executive, and The Commercial Real Estate Show. Nadia also wrote for Multi-Housing News, Commercial Property Executive, HubSpot, and more. Prior to entering the real estate industry, Nadia worked in the legal field, where she gained over 10 years of experience in business, corporate, and real estate law.
Sign up for The Ready Renter newsletter
Get our free apartment hunting guide — plus tips, trends, and research.
")

")

Related posts

Green flags vs. red flags: what to notice on every apartment tour
Finding a place online is the easy part. The apartment tour is where you find out what the photos left out. For a first-time renter,…

Renting like a local: 5 questions to ask before signing a lease in Boston
Boston is one of the most rewarding cities to call home. It’s walkable, full of history and packed with distinct neighborhoods that each have their…

Here’s how to get around Pittsburgh as a renter using public transit
Pittsburgh is a city of three rivers, steep ridges and nearly 450 bridges. All that terrain shapes how you get from your front door to…
Subscribe to
The Ready Renter newsletter


