The National Average Rent Stagnated in January – Cities in America’s Sun Belt Experienced the Fastest Growth
Share this article:
Key takeaways:
- The national average rent reached $1,420 in January 2019, a year-over-year increase of 3.3% ($45), according to data from Yardi Matrix.
- Among the nation’s 250 largest cities, 93% have seen rent increases compared to January 2018, 5% remained flat, and only 2% of cities have seen apartment prices decrease.
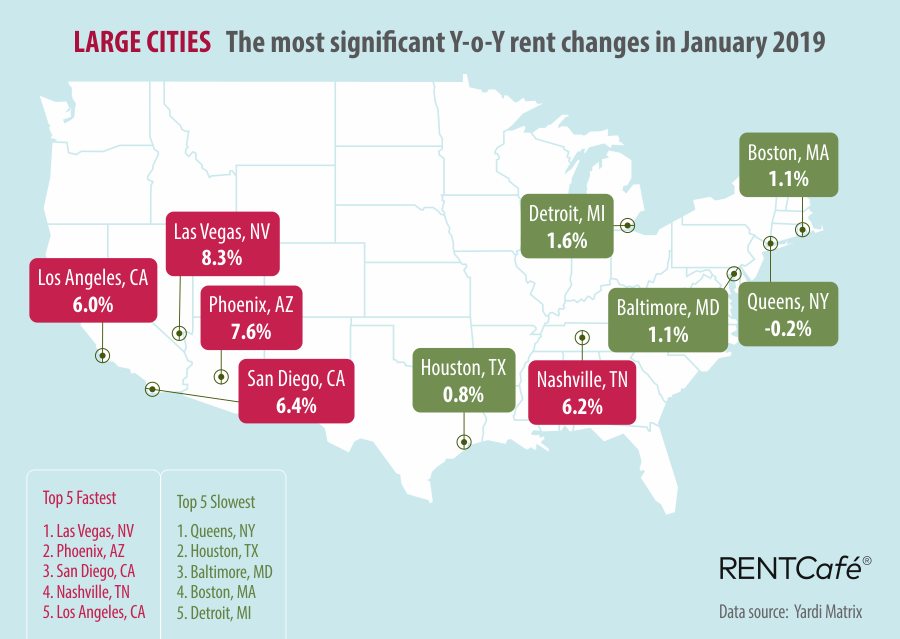
- Rents rose most rapidly in the South, with Las Vegas and Phoenix leading the pack in large cities.
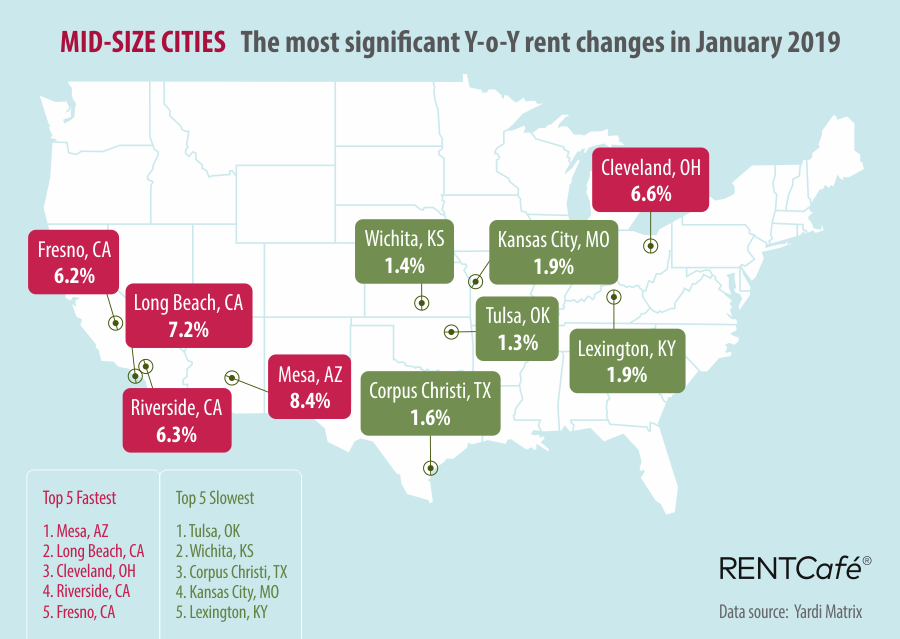
- Among medium-sized cities, Mesa, AZ; Long Beach, CA; and Cleveland, OH, saw the fastest increases in rents.
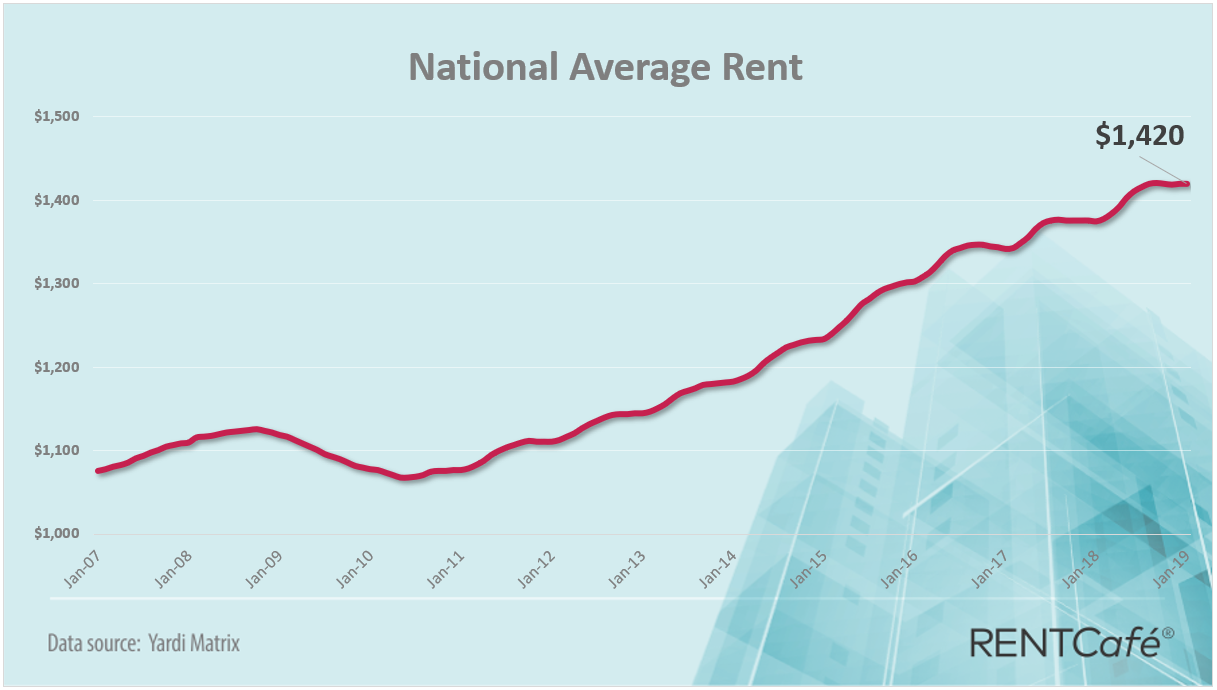
The national average rent remained flat over the month, but rose 3.3% over the year
Although average rents in the United States have not seen a major change since the fall — a normal seasonal lull — they have seen a healthy 3.3% year-over-year increase in January, reaching $1,420, which is $45 more expensive compared to the beginning of 2018. Meanwhile, there was no month-over-month change compared to December.
Several factors, including higher interest rates and rising home prices, could suggest that residential rents will continue to experience growth in 2019. The tight labor market will continue to put upward pressure on rents, especially in some areas, including a number of cities in the South, may continue to see rapid increases in average rents.
Doug Ressler of Yardi Matrix: Despite affordability remaining an issue going forward, demographic trends will continue to support housing demand. The attractiveness of large coastal knowledge-intensive metro areas will persist, but high prices will drive some residents to smaller metro areas away from the coasts. Demand for apartments in attractive areas will remain strong, driven by the strength of the local economies.
One Year Rent Changes in 20 Renter Mega-Hubs January 2019
| City | January 2019 | January 2018 | Percentage Change | Net Change |
|---|---|---|---|---|
| Manhattan (New York City), NY | $4,201 | $4,043 | 3.9% | $158 |
| Los Angeles, CA | $2,459 | $2,320 | 6.0% | $139 |
| Washington, D.C. | $2,145 | $2,077 | 3.3% | $68 |
| Seattle, WA | $2,044 | $1,974 | 3.5% | $70 |
| Chicago, IL | $1,892 | $1,802 | 5.0% | $90 |
| Denver, CO | $1,608 | $1,529 | 5.2% | $79 |
| Atlanta, GA | $1,433 | $1,357 | 5.6% | $76 |
| Orlando, FL | $1,389 | $1,325 | 4.8% | $64 |
| Austin, TX | $1,366 | $1,294 | 5.6% | $72 |
| Tampa, FL | $1,289 | $1,232 | 4.6% | $57 |
| Charlotte, NC | $1,182 | $1,134 | 4.2% | $48 |
| Dallas, TX | $1,186 | $1,149 | 3.2% | $37 |
| Houston, TX | $1,090 | $1,081 | 0.8% | $9 |
| Fort Worth, TX | $1,084 | $1,040 | 4.2% | $44 |
| Jacksonville, FL | $1,059 | $1,000 | 5.9% | $59 |
| Las Vegas, NV | $1,048 | $968 | 8.3% | $80 |
| San Antonio, TX | $1,015 | $980 | 3.6% | $35 |
| Phoenix, AZ | $1,018 | $946 | 7.6% | $72 |
| Columbus, OH | $909 | $879 | 3.4% | $30 |
| Indianapolis, IN | $850 | $819 | 3.8% | $31 |
The largest renter hubs in the Sun Belt see the fastest growth in rents
Since last January, the hottest rental markets out of the 20 largest renter hubs in the U.S. were all located in the Sun Belt. Las Vegas apartments have seen the fastest rent growth in the top 20, having registered an 8.3% year-over-year increase over the past 12-month period. Sin City’s average rent rose to $1,048, up from $968 last January.
Likewise, the average rent for apartments in Phoenix, AZ, also saw a sharp increase of 7.6% year-over-year getting to $1,018, leaving this Arizona city in second place among the largest rental hubs in the country. Rent growth was also brisk in Los Angeles (6%), Jacksonville (5.9%), Atlanta (5.6%) and Austin (5.6%).
Permian Basin cities and Reno see fastest increases in average rents
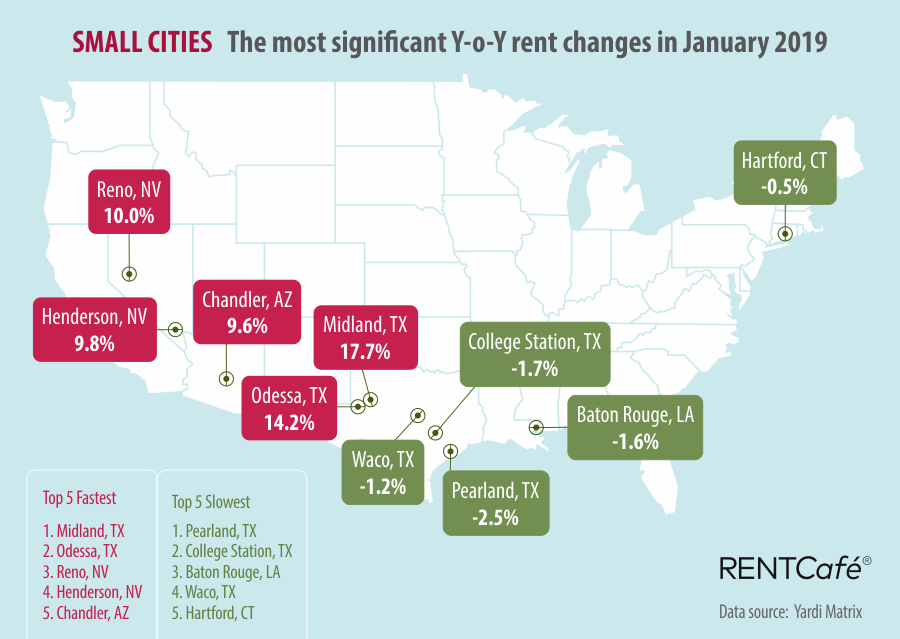
Texas’ oil patch continues to fuel the fastest increases in rent nationwide, with a year-over-year increase of 17.7% in Midland, with an average rent of $1,564, and 14.2% in Odessa, where the average rent was $1,360. However, the pace of change in the Permian Basin does seem to be slowing, as the month-over-month increase was just 0.1% in Midland, and 0.2% in Odessa.
Renters in Reno, NV, have experienced a similar dynamic, as rents have increased a whopping 10% year-over-year. However, the month-over-month change was zero, suggesting that rents in Nevada’s second-largest-city are beginning to stabilize, at least for now. Reno’s average rent is now $1,239, up $113 since last January. This rapid growth is primarily due to the opening of Tesla’s Gigafactory, but large warehouse facilities for major firms ranging from an Amazon Fulfillment Center to Patagonia’s largest warehouse and service center have also contributed.

Among the largest cities in the U.S., the Sun Belt also leads in rent growth
While Las Vegas’ average rent of $1,048 is quite affordable when compared to many urban areas, the increase in average rent of $80 per month, or 8.3% growth over the period of one year, means that the city saw faster increases in rent than any other large American city.
Phoenix, AZ, is also very popular among those moving in from more expensive West Coast states, as the average rent is a manageable $1,018, an increase of 7.6% since this time last year. In absolute terms, this amounts to an average increase of $72 per month.
San Diego (6.4%), Nashville (6.2%), and Los Angeles (6.0%) were also among the largest cities with the fastest increases in average rents, although Nashville’s average rent of $1,347 is far below the average of $2,460 in Los Angeles and $2,184 in San Diego.
The New York City borough of Queens was the only large city where rent actually fell since last January, although only by 0.2%, to $2,196. Houston also experienced a very slow growth rate of only 0.8% year-over-year, and Boston and Baltimore tied for the third-slowest rental growth, with both East Coast cities experiencing only 1.1% increases in average rent since last January.
Apartments in Mesa, Cleveland and 3 cities in California lead increases in mid-sized cities
Apartments in Mesa, AZ, have seen year-over-year price increases of 8.4% on average in January, reaching $981. Long Beach, CA, follows with 7.2% to the current average of $2,008. Rapid increases in rent also occurred in Cleveland, OH (6.6%); Riverside, CA (6.3%); and Fresno, CA (6.2%). As a result, apartments for rent in Cleveland now go for $1,072 on average, while Riverside’s average rent has reached $1,523, with Fresno renters paying $1,048 on average last month.
See the complete list of cities at the end of this report.
At the other extreme, Tulsa, OK, experienced the slowest increase recorded among mid-sized cities, 1.3% year-over-year, with an average rent of $680. Apartments in Wichita, KS, rent for $642 on average, a contained 1.4% increase since last January. Meanwhile, Corpus Christi, TX, experienced the third-slowest increase in rent among mid-sized cities, rising to $966, a 1.6% increase y-o-y.
The average rent was $973 in Kansas City, MO, and $893 in Lexington, KY, amounting to a modest 1.9% increase since last January.
Small cities in the Sun Belt see sharp growth
The three fastest increases in rent nationwide all occurred in small cities such as Midland (17.7%), Odessa (14.2%), and Reno (10%). Las Vegas’ neighbor Henderson, NV, also saw rapid growth, with an increase in average rent of 9.8% to $1,254, and two Arizona cities round out the top six, with an average increase in rent of 9.6% in Chandler and 9.5% in Glendale, both of which are Phoenix suburbs.
The top 10 most expensive and least expensive rent prices in the U.S.
| City | State | Average rent |
|---|---|---|
| Manhattan | NY | $4,201 |
| San Francisco | CA | $3,609 |
| Boston | MA | $3,274 |
| San Mateo | CA | $3,218 |
| Cambridge | MA | $3,063 |
| Sunnyvale | CA | $2,906 |
| Jersey City | NJ | $2,903 |
| Santa Clara | CA | $2,870 |
| Brooklyn | NY | $2,852 |
| San Jose | CA | $2,730 |
| City | State | Average rent |
|---|---|---|
| Wichita | KS | $642 |
| Tulsa | OK | $680 |
| Brownsville | TX | $694 |
| Toledo | OH | $704 |
| Killeen | TX | $711 |
| Amarillo | TX | $733 |
| Independence | MO | $736 |
| Dayton | OH | $744 |
| Oklahoma City | OK | $752 |
| Fort Wayne | IN | $755 |
Curious about rents in cities like Miami, Minneapolis, Cincinnati, or Portland? Check the average price of rent in your city by using this interactive table:
| City | State | Average Rent | Change M-o-M | Change Y-o-Y |
|---|---|---|---|---|
| Wichita | KS | $642 | 0.00% | 1.40% |
| Tulsa | OK | $680 | -0.10% | 1.30% |
| Brownsville | TX | $694 | 0.90% | 0.70% |
| Toledo | OH | $704 | -0.40% | 3.80% |
| Killeen | TX | $711 | 0.30% | 1.90% |
| Amarillo | TX | $733 | -0.10% | 1.00% |
| Independence | MO | $736 | 0.00% | 2.40% |
| Dayton | OH | $744 | 0.30% | 2.80% |
| Oklahoma City | OK | $752 | -0.10% | 3.30% |
| Fort Wayne | IN | $755 | 0.00% | 3.00% |
| Little Rock | AR | $774 | 0.50% | 0.40% |
| El Paso | TX | $775 | -0.10% | 5.20% |
| Jackson | MS | $776 | 0.10% | 1.70% |
| McAllen | TX | $782 | 0.60% | 3.20% |
| Memphis | TN | $784 | 0.00% | 5.70% |
| Warren | MI | $784 | -0.30% | 1.80% |
| Kansas City | KS | $791 | -0.40% | 4.60% |
| Mobile | AL | $798 | -0.40% | 2.80% |
| Broken Arrow | OK | $801 | -1.00% | 0.30% |
| Augusta | GA | $801 | 0.60% | 2.30% |
| Las Cruces | NM | $809 | 0.40% | 1.50% |
| High Point | NC | $812 | 0.60% | 6.40% |
| Macon | GA | $820 | 0.40% | 4.50% |
| Akron | OH | $828 | 0.10% | 1.50% |
| Lansing | MI | $835 | -0.60% | 3.10% |
| Winston-Salem | NC | $835 | 0.20% | 5.30% |
| Tucson | AZ | $844 | 0.70% | 5.60% |
| Indianapolis | IN | $850 | -0.10% | 3.80% |
| Columbus | GA | $852 | -0.10% | 1.70% |
| Paradise | NV | $860 | 0.20% | 5.40% |
| Albuquerque | NM | $866 | -0.10% | 4.10% |
| Pasadena | TX | $866 | -0.60% | 1.30% |
| Norman | OK | $874 | 0.10% | 0.20% |
| Greensboro | NC | $876 | 0.50% | 4.20% |
| Lexington | KY | $893 | 0.10% | 1.90% |
| Des Moines | IA | $894 | 1.10% | 1.50% |
| Omaha | NE | $900 | 0.20% | 2.90% |
| Columbus | OH | $909 | 0.00% | 3.40% |
| South Bend | IN | $910 | 0.80% | 3.20% |
| St. Louis | MO | $911 | 0.30% | 3.80% |
| Sterling Heights | MI | $917 | -0.20% | 4.10% |
| Lubbock | TX | $921 | -0.10% | 1.40% |
| Metairie | LA | $928 | 0.20% | 4.00% |
| Louisville | KY | $929 | 0.70% | 3.80% |
| Olathe | KS | $933 | 0.20% | 2.30% |
| Waterbury | CT | $938 | 0.40% | 0.90% |
| Newport News | VA | $943 | 0.40% | 4.10% |
| Lincoln | NE | $944 | 0.30% | 4.00% |
| Glendale | AZ | $945 | 0.40% | 9.50% |
| Waco | TX | $949 | -0.10% | -1.20% |
| Birmingham | AL | $957 | 0.20% | 3.50% |
| Mesquite | TX | $963 | 0.20% | 2.30% |
| Corpus Christi | TX | $966 | -0.30% | 1.60% |
| Cincinnati | OH | $967 | -0.30% | 2.50% |
| Spokane | WA | $971 | 0.70% | 6.60% |
| Kansas City | MO | $973 | 0.20% | 1.90% |
| Chattanooga | TN | $973 | 0.30% | 5.80% |
| Bakersfield | CA | $975 | -0.10% | 4.40% |
| Mesa | AZ | $981 | 0.40% | 8.40% |
| North Charleston | SC | $1,004 | -0.20% | 2.40% |
| Arlington | TX | $1,005 | 0.00% | 3.60% |
| Hampton | VA | $1,012 | 0.20% | 2.50% |
| Knoxville | TN | $1,012 | 0.70% | 5.70% |
| Rochester | NY | $1,014 | -0.40% | 2.40% |
| San Antonio | TX | $1,015 | 0.00% | 3.60% |
| Lakeland | FL | $1,015 | 0.10% | 2.40% |
| Salem | OR | $1,018 | 0.20% | 5.50% |
| Phoenix | AZ | $1,018 | 0.30% | 7.60% |
| Detroit | MI | $1,028 | -0.40% | 1.60% |
| Baton Rouge | LA | $1,031 | 0.00% | -1.60% |
| Columbia | SC | $1,031 | -0.10% | 3.10% |
| Garland | TX | $1,031 | 0.00% | 5.40% |
| Grand Rapids | MI | $1,031 | -0.70% | 6.60% |
| North Las Vegas | NV | $1,033 | 0.30% | 5.70% |
| Savannah | GA | $1,039 | -1.00% | 2.40% |
| Fresno | CA | $1,048 | -0.20% | 6.20% |
| Las Vegas | NV | $1,048 | 0.40% | 8.30% |
| Buffalo | NY | $1,055 | 0.40% | 0.90% |
| Norfolk | VA | $1,059 | -0.20% | 1.60% |
| Jacksonville | FL | $1,059 | -0.10% | 5.90% |
| Richmond | VA | $1,064 | 0.20% | 4.70% |
| Overland Park | KS | $1,069 | 0.30% | 2.40% |
| Cleveland | OH | $1,072 | 0.10% | 6.60% |
| Clovis | CA | $1,082 | -0.20% | 4.30% |
| Fort Worth | TX | $1,084 | -0.10% | 4.20% |
| Grand Prairie | TX | $1,085 | 0.10% | 5.60% |
| Houston | TX | $1,090 | -0.30% | 0.80% |
| Syracuse | NY | $1,093 | 0.60% | 0.60% |
| Victorville | CA | $1,098 | -0.30% | 6.70% |
| Boise | ID | $1,106 | -0.50% | 6.60% |
| Murfreesboro | TN | $1,110 | 0.40% | 4.20% |
| Wilmington | NC | $1,111 | -0.50% | 5.20% |
| Colorado Springs | CO | $1,113 | 0.20% | 3.40% |
| West Valley City | UT | $1,118 | -1.50% | 6.40% |
| Durham | NC | $1,125 | -0.40% | 4.70% |
| New Orleans | LA | $1,129 | 0.20% | 3.00% |
| Irving | TX | $1,136 | 0.00% | 3.20% |
| Stockton | CA | $1,138 | -0.20% | 5.40% |
| West Jordan | UT | $1,141 | -0.10% | 5.40% |
| Milwaukee | WI | $1,142 | -0.20% | 2.10% |
| Round Rock | TX | $1,142 | 0.10% | 3.40% |
| Peoria | AZ | $1,142 | 0.30% | 8.10% |
| Greeley | CO | $1,143 | 0.20% | 6.30% |
| Lewisville | TX | $1,146 | 0.40% | 3.50% |
| Newark | NJ | $1,156 | -0.90% | 0.20% |
| Raleigh | NC | $1,162 | 0.00% | 5.00% |
| Virginia Beach | VA | $1,174 | 0.00% | 2.80% |
| Hartford | CT | $1,176 | 0.00% | -0.50% |
| Cary | NC | $1,179 | 0.40% | 5.00% |
| Clearwater | FL | $1,180 | 0.10% | 5.00% |
| Charlotte | NC | $1,182 | 0.10% | 4.20% |
| Dallas | TX | $1,186 | -0.10% | 3.20% |
| Brandon | FL | $1,186 | 0.50% | 4.10% |
| College Station | TX | $1,188 | -0.10% | -1.70% |
| Carrollton | TX | $1,190 | -0.30% | 3.70% |
| Modesto | CA | $1,194 | -0.30% | 3.50% |
| Chesapeake | VA | $1,199 | 0.70% | 3.20% |
| Salt Lake City | UT | $1,201 | -0.20% | 8.30% |
| Denton | TX | $1,202 | 0.10% | 3.30% |
| Pittsburgh | PA | $1,210 | -0.20% | 6.10% |
| Tallahassee | FL | $1,213 | 0.80% | 2.70% |
| Elizabeth | NJ | $1,222 | -0.60% | 1.90% |
| Madison | WI | $1,223 | -0.10% | 1.90% |
| McKinney | TX | $1,229 | 0.00% | 1.70% |
| Gilbert | AZ | $1,232 | 0.20% | 7.90% |
| San Bernardino | CA | $1,237 | -0.30% | 9.10% |
| Reno | NV | $1,239 | 0.00% | 10.00% |
| Baltimore | MD | $1,245 | -0.20% | 1.10% |
| Gainesville | FL | $1,247 | 0.30% | 6.50% |
| Henderson | NV | $1,254 | 0.40% | 9.80% |
| Chandler | AZ | $1,263 | 0.40% | 9.60% |
| St. Petersburg | FL | $1,265 | 0.00% | 1.90% |
| Tacoma | WA | $1,267 | 0.60% | 5.80% |
| Gresham | OR | $1,268 | -0.10% | 5.10% |
| Pearland | TX | $1,272 | 0.00% | -2.50% |
| Plano | TX | $1,274 | -0.20% | 1.90% |
| Fontana | CA | $1,277 | -0.50% | 4.10% |
| Rialto | CA | $1,277 | -0.50% | 6.70% |
| Vancouver | WA | $1,280 | -0.50% | 3.20% |
| Lancaster | CA | $1,280 | -0.70% | 6.40% |
| Tampa | FL | $1,289 | 0.20% | 4.60% |
| Charleston | SC | $1,302 | 0.50% | 2.60% |
| Eugene | OR | $1,307 | 0.50% | 4.40% |
| Aurora | IL | $1,308 | 0.50% | 3.90% |
| Richardson | TX | $1,312 | 0.00% | 1.60% |
| Tempe | AZ | $1,313 | 0.50% | 5.20% |
| Aurora | CO | $1,327 | 0.20% | 4.40% |
| Frisco | TX | $1,339 | -0.10% | 1.70% |
| Nashville | TN | $1,348 | 0.10% | 6.20% |
| Odessa | TX | $1,360 | 0.20% | 14.20% |
| Hialeah | FL | $1,365 | 0.60% | 5.30% |
| Sacramento | CA | $1,365 | 0.00% | 6.10% |
| Manchester | NH | $1,366 | -0.10% | 9.40% |
| Austin | TX | $1,366 | 0.20% | 5.60% |
| Pompano Beach | FL | $1,377 | -0.90% | 3.50% |
| Orlando | FL | $1,389 | 0.10% | 4.80% |
| Everett | WA | $1,402 | -0.20% | 4.80% |
| Thornton | CO | $1,410 | 0.10% | 5.90% |
| Arvada | CO | $1,413 | 0.20% | 6.70% |
| West Palm Beach | FL | $1,431 | -0.40% | 4.20% |
| Atlanta | GA | $1,433 | 0.40% | 5.60% |
| Hollywood | FL | $1,438 | -0.60% | 2.50% |
| Scottsdale | AZ | $1,438 | 0.10% | 6.70% |
| Kent | WA | $1,445 | -0.10% | 2.60% |
| Sandy Springs | GA | $1,459 | 0.30% | 5.40% |
| Moreno Valley | CA | $1,462 | -0.60% | 6.20% |
| Naperville | IL | $1,469 | 1.00% | 3.50% |
| Lakewood | CO | $1,471 | 0.10% | 4.00% |
| Westminster | CO | $1,471 | 0.30% | 7.30% |
| Portland | OR | $1,483 | -0.50% | 2.50% |
| Hillsboro | OR | $1,484 | -0.70% | 3.10% |
| Ann Arbor | MI | $1,497 | -0.30% | 2.00% |
| Fort Collins | CO | $1,505 | 0.30% | 3.90% |
| El Cajon | CA | $1,511 | -0.30% | 5.10% |
| Pomona | CA | $1,512 | 0.10% | 7.10% |
| Riverside | CA | $1,523 | -0.40% | 6.30% |
| Minneapolis | MN | $1,541 | 0.10% | 3.10% |
| Midland | TX | $1,564 | 0.10% | 17.70% |
| Santa Maria | CA | $1,566 | -0.40% | 4.00% |
| Philadelphia | PA | $1,568 | 0.10% | 3.40% |
| Edison | NJ | $1,574 | -0.40% | 0.80% |
| Escondido | CA | $1,592 | 0.10% | 4.10% |
| Denver | CO | $1,608 | 0.20% | 5.20% |
| Murrieta | CA | $1,630 | 0.30% | 2.80% |
| Renton | WA | $1,642 | -0.10% | 3.50% |
| Roseville | CA | $1,644 | -0.10% | 5.20% |
| Temecula | CA | $1,654 | -0.80% | 5.40% |
| New Haven | CT | $1,661 | -0.10% | 2.20% |
| Salinas | CA | $1,663 | -0.50% | 5.30% |
| Corona | CA | $1,681 | -0.70% | 4.00% |
| Ontario | CA | $1,681 | -0.20% | 5.50% |
| Miami | FL | $1,684 | -0.10% | 4.50% |
| Coral Springs | FL | $1,694 | -0.10% | 1.60% |
| Alexandria | VA | $1,699 | -0.10% | 3.50% |
| Pembroke Pines | FL | $1,714 | 0.20% | 1.60% |
| Vallejo | CA | $1,732 | -0.10% | 2.20% |
| Honolulu | HI | $1,737 | n/a | n/a |
| Garden Grove | CA | $1,738 | -0.10% | 5.10% |
| Chula Vista | CA | $1,745 | -0.10% | 5.80% |
| Davie | FL | $1,761 | 0.10% | 4.40% |
| Fairfield | CA | $1,763 | -0.20% | 5.20% |
| Vista | CA | $1,768 | 0.30% | 3.60% |
| Anaheim | CA | $1,788 | 0.30% | 3.70% |
| Oceanside | CA | $1,795 | 0.10% | 5.60% |
| West Covina | CA | $1,812 | 0.40% | 5.20% |
| Miramar | FL | $1,839 | 0.20% | 2.60% |
| Rancho Cucamonga | CA | $1,844 | -0.40% | 4.80% |
| Fullerton | CA | $1,878 | -0.10% | 4.20% |
| Chicago | IL | $1,892 | -0.10% | 5.00% |
| Boulder | CO | $1,899 | 0.20% | 2.60% |
| Torrance | CA | $1,908 | -0.20% | 5.60% |
| Fort Lauderdale | FL | $1,918 | -0.60% | 2.50% |
| Santa Ana | CA | $1,921 | 0.10% | 3.80% |
| Santa Clarita | CA | $1,936 | 0.10% | 5.20% |
| Concord | CA | $1,939 | -0.10% | 3.10% |
| Oxnard | CA | $1,941 | 0.10% | 6.20% |
| Santa Rosa | CA | $1,945 | -0.40% | 1.70% |
| Ventura | CA | $1,973 | 0.00% | 5.30% |
| Yonkers | NY | $2,005 | 0.50% | 5.60% |
| Long Beach | CA | $2,008 | 0.00% | 7.20% |
| Simi Valley | CA | $2,023 | 0.20% | 8.50% |
| Orange | CA | $2,026 | 0.00% | 2.80% |
| Seattle | WA | $2,044 | -0.20% | 3.50% |
| Costa Mesa | CA | $2,071 | -0.10% | 3.50% |
| Thousand Oaks | CA | $2,124 | 0.40% | 5.90% |
| Hayward | CA | $2,144 | 0.20% | 6.00% |
| Washington | DC | $2,145 | -0.10% | 3.30% |
| Huntington Beach | CA | $2,153 | 0.10% | 7.80% |
| Arlington | VA | $2,156 | 0.10% | 4.50% |
| Bellevue | WA | $2,159 | -0.20% | 4.00% |
| San Diego | CA | $2,181 | -0.10% | 6.40% |
| Queens | NY | $2,196 | 0.00% | -0.20% |
| Carlsbad | CA | $2,273 | -0.10% | 4.20% |
| Burbank | CA | $2,274 | 0.00% | 6.40% |
| Stamford | CT | $2,368 | -0.60% | 1.10% |
| Irvine | CA | $2,399 | -0.10% | 1.30% |
| Fremont | CA | $2,406 | 0.30% | 4.20% |
| Los Angeles | CA | $2,459 | 0.00% | 6.00% |
| Daly City | CA | $2,508 | -0.20% | 6.50% |
| Glendale | CA | $2,531 | 0.10% | 5.50% |
| Pasadena | CA | $2,563 | 0.40% | 6.30% |
| Oakland | CA | $2,687 | 0.10% | 3.30% |
| San Jose | CA | $2,730 | 0.00% | 4.70% |
| Brooklyn | NY | $2,852 | 0.00% | 4.00% |
| Santa Clara | CA | $2,870 | 0.10% | 5.60% |
| Jersey City | NJ | $2,903 | 0.50% | 2.40% |
| Sunnyvale | CA | $2,906 | -0.10% | 5.90% |
| Cambridge | MA | $3,063 | -0.90% | 2.30% |
| San Mateo | CA | $3,218 | -0.20% | 4.80% |
| Boston | MA | $3,274 | -1.20% | 1.10% |
| San Francisco | CA | $3,609 | 0.10% | 4.90% |
| Manhattan | NY | $4,201 | 0.00% | 3.90% |
[mailmunch-form id=”583374″]
Methodology:
RentCafe is a nationwide apartment search website that enables renters to easily find apartments and houses for rent throughout the United States.
To compile this report, RentCafe’s research team analyzed rent data across the 252 largest cities in the US. The report is exclusively based on apartment data related to buildings containing 50 or more units. Our report includes cities with populations over 100,000 and a rental stock of at least 2,900 apartments in 50+ unit buildings.
In this report, large cities are cities with a population of 600,000 people or more, mid-sized cities are cities with a population between 300,000 and 600,000, and small cities are cities with a population of less than 300,000.
Rent data was provided by Yardi Matrix, a business development and asset management tool for brokers, sponsors, banks and equity sources underwriting investments in the multifamily, office, industrial and self-storage sectors. Rental rate coverage is for Market Rate properties only. Fully Affordable properties are not included in the Yardi Matrix rental surveys and are not reported in rental rate averages.
Starting with the January 2017 rent survey, Yardi Matrix is using a methodology that incorporates more properties into the sample which caused slight changes in overall rents and year-over-year changes compared to the previous reports. We expect this methodology adjustment to produce more accurate averages at the national and metro levels.
*National averages include over 130 markets across the U.S., as reported by Yardi Matrix.
Fair use and redistribution
We encourage you and freely grant you permission to reuse, host, or repost the images in this article. When doing so, we only ask that you kindly attribute the authors by linking to
Share this article:

Nadia Balint
Nadia Balint is a senior creative writer for RENTCafé. She covers news and trends in residential and commercial real estate and their impact on our everyday life, including rental housing, for-sale housing, real estate development, homeownership, market reports, insurance, landlord-tenant laws, personal finance, urban development, economy, sustainability, and social issues. Nadia holds a B.S. in Business Management from Northeastern Illinois University in Chicago. You can connect with Nadia via email.
Nadia’s work and expertise have been quoted by major national and local media outlets, including CNN, CNBC, CBS News, Curbed, The NY Post, The Chicago Tribune, The Denver Post as well as industry publications, such as GlobeSt, Bisnow, Inman News, Multifamily Executive, and The Commercial Real Estate Show. Nadia also wrote for Multi-Housing News, Commercial Property Executive, HubSpot, and more. Prior to entering the real estate industry, Nadia worked in the legal field, where she gained over 10 years of experience in business, corporate, and real estate law.
Sign up for The Ready Renter newsletter
Get our free apartment hunting guide — plus tips, trends and research.
")

")

Related posts

Your first month of solo apartment life: A week-by-week guide for new renters
Moving into your own apartment is one of the most exciting milestones of young adulthood. But it’s also one of the most overwhelming. Between setting…

5 questions to ask before renting an apartment in Asheville, NC
Asheville has earned its reputation for good reason. The food scene punches well above its weight, the Blue Ridge Mountains are a short drive away…
June 2026 self storage report: Rents slip 1.5% annually, edge up 0.7% from May
National street rates averaged $135 in June 2026, down 1.5% year-over-year but up 0.7% from May, as the summer moving season provides a modest seasonal…
Subscribe to
The Ready Renter newsletter


