Share this article:
For many people working in large US cities, daily commutes are inevitable. Traveling to and from work eats up a lot of time for the average American, but how has commuting time changed in the last 10 years?
COMMERCIALCafe recently released a report on how the time we spend commuting changed in the past decade. The study references U.S. Census data and highlights cities with a population of over 500,000. Unsurprisingly, commuting time increased in almost every city, especially in congested coastal cities and tech hubs. In 2017, the average American spent 54 minutes per day commuting, up from 51 minutes per day in 2008.
When it comes to the distribution of commuters in the workforce, 1% fewer workers commute today than 10 years ago. This is partly because there are more freelancers and remote workers. Commuting by bike and on foot have also increased in popularity overall.
Commuting Time Soars in Cities on Both Coasts
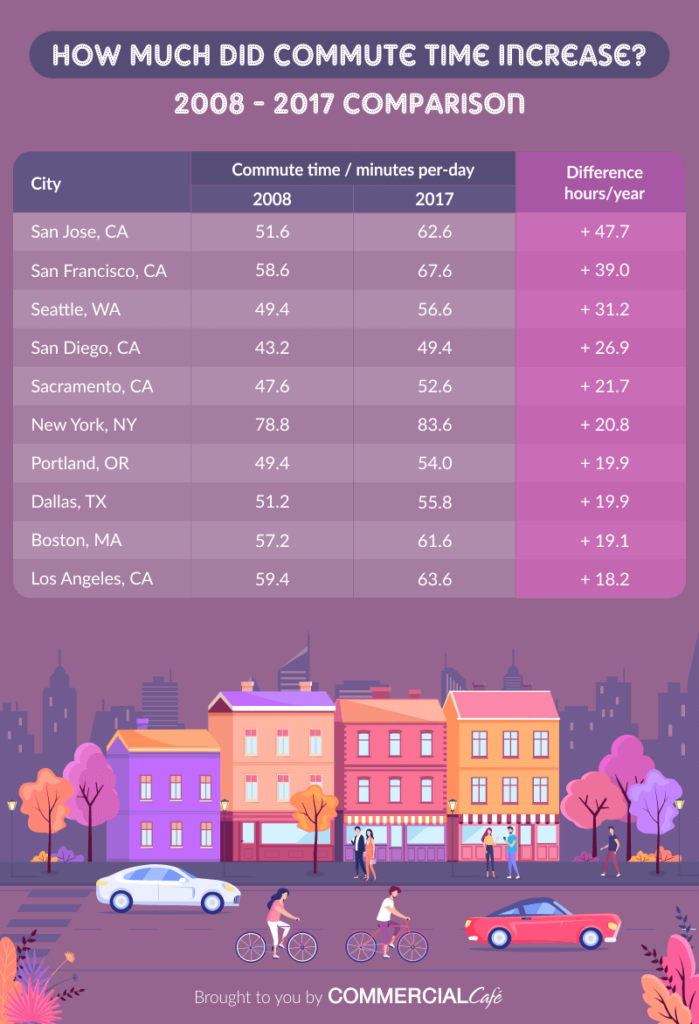
In San José, commuting time increased by 11 minutes per day since 2008 – the most among the cities studied. This 21% increase adds up to almost two extra days per year spent on the road for commuters in the booming tech hub. We can link this to an 18% increase in its workforce since 2008, coupled with a general population increase of 13%.
Meanwhile, Seattle saw a 15% increase in commuting time. The result is an extra 7.2 minutes per day – or more than 31 hours per year – spent on the road, partly attributed to the city’s transportation problems. Seattle also saw a 24% increase in overall population and workforce, the highest on the list. Portland is in a similar situation, as the workforce here increased by 20%, resulting in more time spent commuting.
Commuting time in New York City increased from 78.8 minutes a day to a notable 83.6 minutes in the past decade. At the same time, more than half of the commuters in the nation’s most populous city use public transit. In fact, public transportation is a popular option in all of the cities where commuting time increased the most, and people who use public transit systems spend considerably more time getting to work.
5 of the Top 10 Cities with Increased Commuting Times are in California
San José, San Francisco, San Diego, Sacramento, and Los Angeles all saw significant increases in population and workforce, resulting in longer commuting times across the state.
Following San José, commuting time increased the most in San Francisco; commuters here spend 39 more hours on their way to work than they did 10 years earlier.
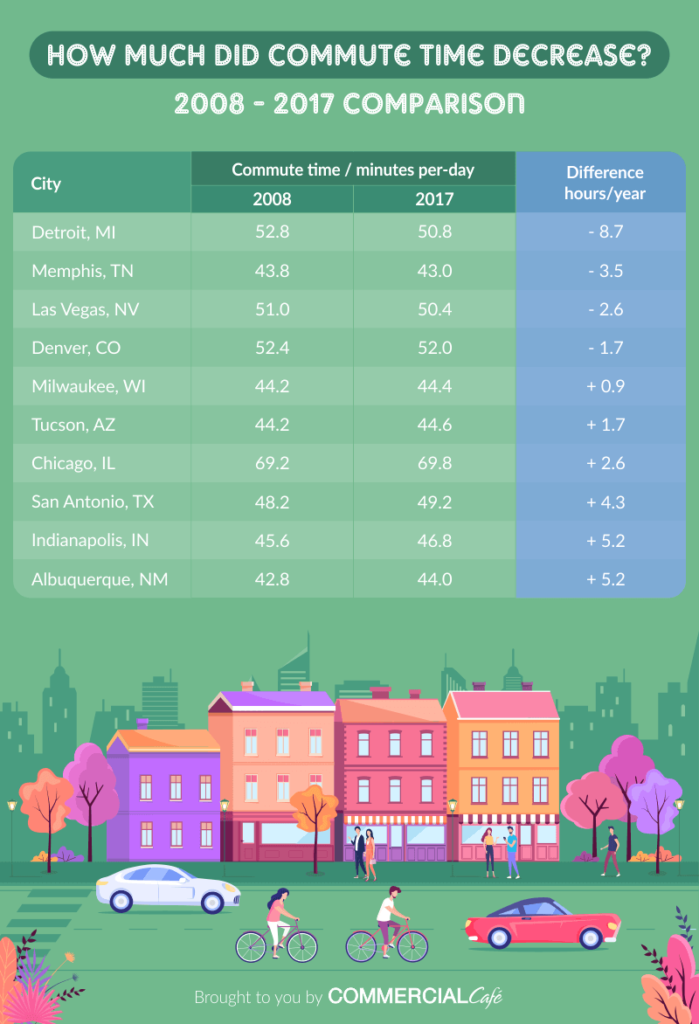
Commuting Time Improves in Several Cities
It should come as no surprise that infrastructure has a considerable influence on commuting time. In San Antonio, although the number of workers increased by 18% over the past decade, commuting time only increased by one minute per day. This may be because Texas is considered the state with the best infrastructure.
If you work in Denver, things are also looking up for you. Denver is one of only four cities to see a decrease in commuting time, although its workforce increased by almost 25%. In fact, 8 of the top 10 cities saw increases in the number of workers.
Conclusions after 10 Years of Commuting Trends
Commuting trends have changed in meaningful ways in the past decade, and many of the cities included in the study saw increases in their commuting times. Most of us still drive to work, but alternative transportation is seeing increasing use.
As more people begin working from home and the U.S. population undergoes demographic shifts, transit times for commuters will likely be affected one way or another. What remains to be seen is whether cities will take the appropriate measures to ensure that commuting times improve.
Methodology
The data the study is based on was sourced from the U.S. Census Bureau of Labor Statistics, using estimates from the years 2008 and 2017.
Daily commuting time was calculated by taking the average commute time provided by the U.S. Census and multiplying it by two.
The study only includes ties with a population over 500,000. It highlighted the cities where commuting time increased or decreased the most.
Additional hours spent commuting per year were obtained by multiplying minutes spent commuting per day by 260 (average number of working days in a year) and dividing the result by 60 (minutes in an hour).
Share this article:

Lucian Alixandrescu
Lucian is a senior content writer for CommercialCafe, specializing in commercial real estate research and data-driven reporting since 2019. With deep expertise in industrial real estate, office markets, demographics, and economics, he produces comprehensive market studies and insights on national and regional CRE trends. He also reports on adjacent subjects such as population shifts and the job market. His reports have been cited by and featured in The New York Times, Forbes, NBC, Bisnow, The Business Journals, and Yahoo Finance. Lucian holds a background in language and literature studies and brings more than 5 years of previous freelance writing experience to his commercial real estate journalism.
Sign up for The Ready Renter newsletter
Get our free apartment hunting guide — plus tips, trends and research.
")

")

Related posts

From dorm to lease: What changes when you get your first apartment
In a dorm, your biggest housing decision may have been which of you got the window side of the room. Your first apartment works differently….

Millennial renters with kids: Navigating the shift from ‘cool apartment’ to ‘family-friendly rental’
Millennial renters with kids face a unique crossroads: the apartment lifestyle they built in their twenties no longer fits the life they’re building in their…

5 questions to ask before renting an apartment in Surprise, AZ
Surprise has gone from a quiet agricultural town into one of the fastest-growing cities in the Phoenix West Valley, attracting families, professionals and retirees. But…
Subscribe to
The Ready Renter newsletter