Rent Pressure Shifts from Hot Cities to Mid-Tier Housing Markets in May
Share this article:
Key takeaways:
- Average rents on U.S. apartments rose by $4, or 0.3%, in May, hitting $1,316 for the month, according to Yardi Matrix.
- In terms of rent growth, California was home to eight of the 15 fastest-growing cities in the country. Stockton came in at No. 1 once again, while Sacramento rose three spots since April alone.
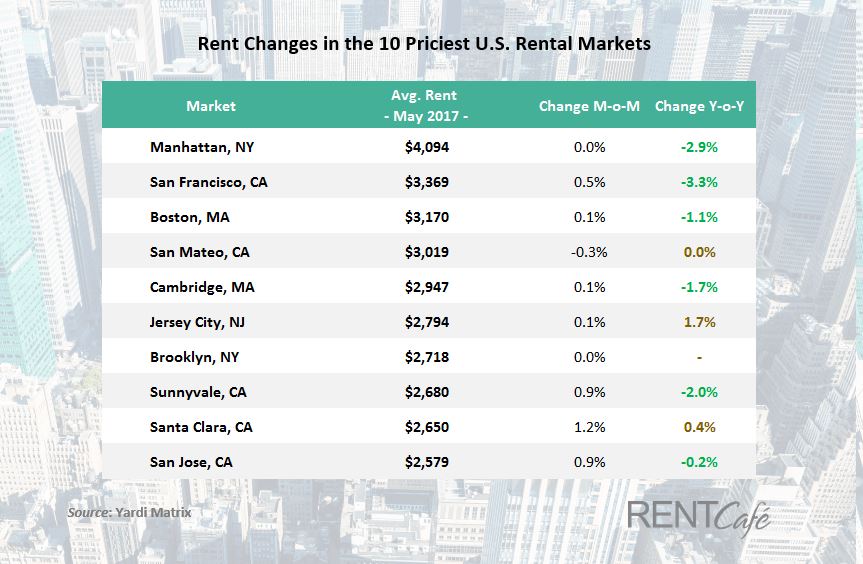
- Rents were just shy of $4,100 month in the nation’s most expensive rental market in May: Manhattan, New York.
- San Francisco led the pack in terms of rent decreases, with a 3.3% dip over the last 12 months. This marks the fourth month San Fran has topped the list.
- 76% of the country’s largest cities (189 cities total) saw rents increase in May, while rents flat-lined in another 45. Rent decreased in just 15 of the 250 cities we surveyed
Rents rose yet again, but just like last month – and the 13 months before that – their growth rate is gradually slowing down. May rents hits $1,316 for the month, rising a mere 0.3% since April and only 1.5% over the last year, according to data from Yardi Matrix. With the slowest growth rate we’ve seen in the last three years, the golden days for landlords may be coming to a close.

Rent growth is slowing so much, in fact, that rents have cooled off in even the nation’s hottest markets.
Average rents dropped in six out of the top 10 most expensive markets last month, including in Manhattan, San Francisco, and Boston – some of the country’s most notoriously high-priced places for renters. In another two pricey markets — California’s San Mateo and Santa Clara — they remained virtually unchanged compared to the last year. The only top 10 location to see any sort of year-over-year increase last month was Jersey City where rents edged up just 1.7% over the year.
Larger Properties Edge Up; Studios Still See Most Annual Growth
While one-, two- and three-bedroom apartments saw the most month-over-month growth, rising 0.3% since April, studio rentals saw the most annual growth once again, ticking up 2.4% year-over-year. One-bedroom apartments rose 2.2%, while two- and three-bedrooms each increased 1.9% over the year.
| Bedroom Type | Average Rent | Change M-o-M | Change Y-o-Y |
|---|---|---|---|
| Studio | $1,172 | 0.2% | 2.4% |
| 1 Bed | $1,190 | 0.3% | 2.2% |
| 2 Beds | $1,394 | 0.3% | 1.9% |
| 3 Beds | $1,617 | 0.3% | 1.9% |
Hot Markets Cool Off; Already-Affordable Cities Plunge Lower
For the fourth month in a row, San Francisco rents saw the highest year-over-year decrease, dipping 3.3% since May 2016. Clocking in at $3,369, they’re still some of the nation’s priciest, but their consistent freefall has many wondering: are the days of ever-climbing rents finally coming to an end?
Throw in the big price decreases of costly markets like Manhattan (down 2.9% over the year); Cambridge, MA (down 1.7%); and Sunnyvale, CA (down 2%), and we’ve got a head-scratcher on our hands. Could it be apartment supply is finally catching up with demand in these ever-popular cities?
It’s true: apartment construction has boomed in the last seven years, with particular growth in California, New York, and the South. Manhattan added more than 6,000 units in the Hell’s Kitchen area alone, while Long Island saw a jump of nearly 13,000 rentals. On the West Coast, Downtown Los Angeles gained 35 new apartment buildings for a total of 7,551 units since 2010 alone. Proving the true impact this new construction is having, new units now make up 63% of DTLA’s apartment inventory.
And that impact is only going to grow. According to Doug Ressler, senior analyst at Yardi Matrix, we can expect construction to continue edging down rents even more.
“Renters have much reason to be optimistic,” Ressler said. “After a long period of incessant rent increases, rents are finally slowing down — even in some of the country’s higher-rent cities, like San Francisco and New York. Even if demand for apartment living is still robust, rent growth will continue to taper off in the coming months, mainly prompted by the record number of new apartments entering the country’s tightest markets.”
But it wasn’t just the more expensive markets that saw deceleration in May. Already-affordable places like Oklahoma City and Broken Arrow in Oklahoma, and El Paso and Corpus Christi in Texas, saw significant drops, too. Oklahoma City rents dropped 2.9% over the year, while rents in Tulsa, OK, rents decreased to a low $655 per month — less than half the national average.
U.S. Cities Where Rents Have Fallen Y-o-Y
| # | City | State | Change Y-o-Y | Average Rent |
|---|---|---|---|---|
| 1 | San Francisco | CA | -3.3% | $3,369 |
| 2 | Manhattan (New York City) | NY | -2.9% | $4,094 |
| 3 | Oklahoma City | OK | -2.9% | $713 |
| 4 | Tulsa | OK | -2.8% | $665 |
| 5 | Broken Arrow | OK | -2.7% | $793 |
| 6 | Sunnyvale | CA | -2.0% | $2,680 |
| 7 | Oakland | CA | -1.9% | $2,420 |
| 8 | Cambridge | MA | -1.7% | $2,947 |
| 9 | Norman | OK | -1.6% | $864 |
| 10 | College Station | TX | -1.6% | $1,192 |
| 11 | Corpus Christi | TX | -1.5% | $955 |
| 12 | Thornton | CO | -1.5% | $1,301 |
| 13 | El Paso | TX | -1.2% | $741 |
| 14 | Boston | MA | -1.1% | $3,170 |
| 15 | Round Rock | TX | -1.1% | $1,097 |
West Coast Cities Dominate Fastest-Growing Rents List
Anomalies like San Francisco and Sunnyvale aside, California cities continued to dominate the list of fastest-growing rents. The West Coast state accounted for eight of the top 15 cities, with Stockton taking the no. 1 spot for yet another month. With a 10.6% increase over the year, the city now boasts average rents of $1,030 per month.
The California cities of Sacramento, Lancaster, Santa Rosa, Modesto, Victorville, Fairfield, and El Cajon all made the fastest-growing list. Meanwhile, other Western cities filled in the gaps. Colorado Springs, CO, came in at no. 2 with a 10.2% jump over the year, and Reno, NV; Tacoma and Spokane, WA; and Salem, OR, also made the list.
The only non-Western cities to make an appearance in our ranking were North Charleston, SC, and Buffalo, NY, which saw annual increases of 7.2% and 9.4%, respectively.
The Cities With the Fastest Growing Rents – May 2017
| # | City | State | Change Y-o-Y | Average Rent |
|---|---|---|---|---|
| 1 | Stockton | CA | 10.6% | $1,030 |
| 2 | Colorado Springs | CO | 10.1% | $1,048 |
| 3 | Buffalo | NY | 9.4% | $933 |
| 4 | Reno | NV | 8.4% | $1,041 |
| 5 | Sacramento | CA | 8.2% | $1,214 |
| 6 | Lancaster | CA | 7.9% | $1,102 |
| 7 | Tacoma | WA | 7.9% | $1,117 |
| 8 | Santa Rosa | CA | 7.8% | $1,784 |
| 9 | Modesto | CA | 7.7% | $1,085 |
| 10 | Spokane | WA | 7.5% | $870 |
| 11 | Victorville | CA | 7.4% | $972 |
| 12 | Fairfield | CA | 7.4% | $1,598 |
| 13 | El Cajon | CA | 7.2% | $1,391 |
| 14 | North Charleston | SC | 7.2% | $985 |
| 15 | Salem | OR | 7.1% | $935 |
Amarillo Makes First-Time Lowest-Rent Appearance; NY, MA, CA Rule High-Rent Rankings
To the surprise of no one, Wichita again took the no. 1 spot for lowest rents in the country. At just $633 per month, Wichita’s rent is less than half the national average. Likewise, the second and third positions remained unchanged, with Toledo, OH, and Tulsa reclaiming their spots at $661 and $665, respectively.
And although some of the remaining cities swapped places, the bulk of the country’s lowest-rent markets stayed steady for May, with the exception of one newcomer: Amarillo, TX. The city ousted former no. 10 (Memphis, TN) with a bargain-basement price of $728 per month.
On the opposite side of the spectrum, the list of highest-rent markets remained stable as well. Manhattan, San Francisco, and Boston once again took the top three spots, with rents of $4,094, $3,369, and $3,170, respectively. Five California cities made the list, including Sunnyvale, Santa Clara, San Mateo, and San Jose, while the remaining cities hailed from the Northeast — Massachusetts, New Jersey, and New York, to be more specific.
| City | State | Average Rent |
|---|---|---|
| Manhattan | NY | $4,094 |
| San Francisco | CA | $3,369 |
| Boston | MA | $3,170 |
| San Mateo | CA | $3,019 |
| Cambridge | MA | $2,947 |
| Jersey City | NJ | $2,794 |
| Brooklyn | NY | $2,718 |
| Sunnyvale | CA | $2,680 |
| Santa Clara | CA | $2,650 |
| San Jose | CA | $2,579 |
| City | State | Average Rent |
|---|---|---|
| Wichita | KS | $633 |
| Toledo | OH | $661 |
| Tulsa | OK | $665 |
| Brownsville | TX | $692 |
| Killeen | TX | $696 |
| Fort Wayne | IN | $701 |
| Independence | MO | $709 |
| Oklahoma City | OK | $713 |
| Dayton | OH | $725 |
| Amarillo | TX | $728 |
We’ve expanded our coverage for the monthly rent report to 250 cities — to be more exact, the ones that have populations over 100K and a rental stock of at least 2,800 apartments in buildings with 50 units and more.
Curious about cities like Miami, Austin, Phoenix, or Cincinnati? See where your city stands when it comes to rent growth and average rent prices by checking out this table:
| City | State | Average Rent | Change M-o-M | Change Y-o-Y |
|---|---|---|---|---|
| Manhattan (New York City) | NY | $4,094 | 0.00% | -2.90% |
| San Francisco | CA | $3,369 | 0.50% | -3.30% |
| Boston | MA | $3,170 | 0.10% | -1.10% |
| San Mateo | CA | $3,019 | -0.30% | 0.00% |
| Cambridge | MA | $2,947 | 0.10% | -1.70% |
| Jersey City | NJ | $2,794 | 0.10% | 1.70% |
| Brooklyn | NY | $2,718 | 0.00% | - |
| Sunnyvale | CA | $2,680 | 0.90% | -2.00% |
| Santa Clara | CA | $2,650 | 1.20% | 0.40% |
| San Jose | CA | $2,579 | 0.90% | -0.20% |
| Daly City | CA | $2,462 | 0.40% | 2.20% |
| Oakland | CA | $2,420 | 0.60% | -1.90% |
| Stamford | CT | $2,357 | 0.40% | 0.00% |
| Pasadena | CA | $2,317 | 0.30% | 1.20% |
| Irvine | CA | $2,313 | 0.30% | 2.40% |
| Fremont | CA | $2,304 | 0.70% | -0.60% |
| Glendale | CA | $2,276 | 0.30% | 3.30% |
| Los Angeles | CA | $2,226 | 0.80% | 4.80% |
| Bellevue | WA | $2,088 | 0.60% | 1.50% |
| Carlsbad | CA | $2,086 | 0.40% | 1.00% |
| Burbank | CA | $2,060 | 0.00% | 1.90% |
| Arlington | VA | $2,060 | 0.40% | 0.00% |
| Washington | DC | $2,009 | -0.40% | -0.80% |
| Thousand Oaks | CA | $2,005 | 0.80% | 2.10% |
| Hayward | CA | $2,002 | 0.40% | 2.60% |
| Costa Mesa | CA | $1,956 | 0.20% | 3.10% |
| San Diego | CA | $1,954 | 0.60% | 1.60% |
| Huntington Beach | CA | $1,929 | 0.20% | 2.10% |
| Orange | CA | $1,920 | 0.30% | 3.10% |
| Seattle | WA | $1,901 | 0.70% | 3.40% |
| Concord | CA | $1,850 | 0.20% | 3.10% |
| Long Beach | CA | $1,832 | 0.70% | 4.40% |
| Simi Valley | CA | $1,816 | 0.50% | 2.10% |
| Santa Ana | CA | $1,802 | 0.30% | 4.00% |
| Ventura | CA | $1,792 | 0.10% | 1.80% |
| Santa Rosa | CA | $1,784 | 0.60% | 7.80% |
| Chicago | IL | $1,774 | 0.10% | 0.90% |
| Oxnard | CA | $1,763 | -0.10% | 3.40% |
| Yonkers | NY | $1,760 | 0.90% | 4.00% |
| Fort Lauderdale | FL | $1,755 | -0.40% | 3.10% |
| Fullerton | CA | $1,748 | 0.30% | 3.10% |
| Boulder | CO | $1,747 | 0.20% | 0.50% |
| Santa Clarita | CA | $1,743 | -0.80% | -0.60% |
| Miramar | FL | $1,741 | -0.50% | 0.80% |
| Torrance | CA | $1,709 | 0.60% | 5.30% |
| Anaheim | CA | $1,688 | 0.40% | 5.10% |
| Rancho Cucamonga | CA | $1,672 | 0.20% | 0.90% |
| West Covina | CA | $1,670 | 1.30% | 5.20% |
| Coral Springs | FL | $1,655 | 1.00% | 5.00% |
| Davie | FL | $1,653 | 0.00% | 2.40% |
| Pembroke Pines | FL | $1,651 | 0.50% | 5.60% |
| Alexandria | VA | $1,651 | -0.10% | 0.10% |
| Oceanside | CA | $1,645 | 0.30% | 3.30% |
| Vista | CA | $1,640 | 0.60% | 1.40% |
| Garden Grove | CA | $1,630 | 0.50% | 4.70% |
| Vallejo | CA | $1,615 | 0.40% | 1.10% |
| Fairfield | CA | $1,598 | 0.40% | 7.40% |
| Chula Vista | CA | $1,580 | 0.30% | 3.50% |
| Miami | FL | $1,578 | -0.40% | 2.80% |
| New Haven | CT | $1,563 | 0.60% | 2.80% |
| Ontario | CA | $1,558 | 0.20% | 4.80% |
| Corona | CA | $1,554 | 0.80% | 5.40% |
| Murrieta | CA | $1,547 | 1.20% | 6.50% |
| Salinas | CA | $1,529 | 1.20% | 5.20% |
| Renton | WA | $1,515 | 0.70% | 1.20% |
| Temecula | CA | $1,503 | 0.70% | 4.60% |
| Edison | NJ | $1,498 | 0.40% | 2.60% |
| Roseville | CA | $1,487 | 0.40% | 2.10% |
| Santa Maria | CA | $1,484 | 1.20% | 6.30% |
| Philadelphia | PA | $1,470 | 0.00% | 1.30% |
| Hillsboro | OR | $1,456 | 0.60% | 0.30% |
| Denver | CO | $1,453 | 0.10% | 0.30% |
| Escondido | CA | $1,452 | 0.30% | 5.70% |
| Pomona | CA | $1,450 | 0.10% | 5.90% |
| Portland | OR | $1,443 | 0.60% | 0.30% |
| Minneapolis | MN | $1,433 | 0.30% | 4.10% |
| Naperville | IL | $1,423 | 0.60% | 2.90% |
| Ann Arbor | MI | $1,403 | -0.10% | 2.50% |
| El Cajon | CA | $1,391 | 0.60% | 7.20% |
| Riverside | CA | $1,376 | 0.30% | 4.40% |
| Lakewood | CO | $1,374 | 0.30% | 0.30% |
| Moreno Valley | CA | $1,340 | -0.10% | 5.30% |
| Sandy Springs | GA | $1,339 | 0.30% | 0.40% |
| Fort Collins | CO | $1,329 | -0.20% | -0.80% |
| Westminster | CO | $1,327 | 0.50% | -0.10% |
| Atlanta | GA | $1,324 | 0.50% | 2.80% |
| Kent | WA | $1,319 | 0.50% | 4.40% |
| West Palm Beach | FL | $1,312 | 0.00% | 4.50% |
| Thornton | CO | $1,301 | 0.20% | -1.50% |
| Hollywood | FL | $1,300 | 1.30% | 3.60% |
| Frisco | TX | $1,296 | -0.10% | 0.60% |
| Everett | WA | $1,291 | 0.50% | 3.10% |
| Austin | TX | $1,288 | -0.20% | -0.60% |
| Scottsdale | AZ | $1,285 | 0.20% | 4.20% |
| Richardson | TX | $1,280 | -0.20% | 3.30% |
| Pearland | TX | $1,272 | 0.00% | -0.60% |
| Pompano Beach | FL | $1,255 | -0.40% | 3.50% |
| Aurora | IL | $1,253 | 0.20% | 3.00% |
| Hialeah | FL | $1,248 | 0.60% | 4.70% |
| Nashville | TN | $1,248 | 0.20% | 2.80% |
| Arvada | CO | $1,245 | 0.20% | 1.70% |
| Charleston | SC | $1,244 | 1.00% | 4.70% |
| Plano | TX | $1,242 | 0.10% | 0.30% |
| Orlando | FL | $1,235 | 0.40% | 2.20% |
| Aurora | CO | $1,218 | 0.00% | -0.40% |
| Eugene | OR | $1,217 | 1.30% | 6.70% |
| Manchester | NH | $1,216 | -0.20% | 2.40% |
| Sacramento | CA | $1,214 | 0.50% | 8.20% |
| Baltimore | MD | $1,197 | 0.70% | 2.30% |
| McKinney | TX | $1,194 | 0.10% | 0.40% |
| College Station | TX | $1,192 | -1.00% | -1.60% |
| Tempe | AZ | $1,191 | 0.30% | 4.10% |
| Vancouver | WA | $1,187 | 0.60% | 4.30% |
| Gresham | OR | $1,176 | 0.20% | 2.50% |
| Madison | WI | $1,170 | -0.30% | 1.80% |
| Tampa | FL | $1,168 | -0.10% | 3.80% |
| Fontana | CA | $1,164 | 0.20% | 6.60% |
| Hartford | CT | $1,162 | 0.00% | 0.90% |
| St. Petersburg | FL | $1,156 | -0.50% | 2.20% |
| Rialto | CA | $1,153 | 0.10% | 4.40% |
| Chesapeake | VA | $1,139 | 0.10% | 0.30% |
| Tallahassee | FL | $1,135 | 0.60% | 3.80% |
| Carrollton | TX | $1,125 | -0.30% | 2.50% |
| Pittsburgh | PA | $1,121 | 0.40% | 1.60% |
| Cary | NC | $1,120 | 0.50% | 2.10% |
| Virginia Beach | VA | $1,120 | 0.70% | 0.00% |
| Tacoma | WA | $1,117 | 0.40% | 7.90% |
| Charlotte | NC | $1,113 | 0.00% | 2.00% |
| Midland | TX | $1,112 | 2.20% | 6.70% |
| Denton | TX | $1,112 | 0.20% | 1.80% |
| Dallas | TX | $1,107 | -0.10% | 2.90% |
| Elizabeth | NJ | $1,107 | 0.40% | 2.20% |
| Gainesville | FL | $1,105 | 0.10% | 3.40% |
| Lancaster | CA | $1,102 | 0.40% | 7.90% |
| Lewisville | TX | $1,102 | -0.20% | 1.50% |
| Newark | NJ | $1,100 | 0.00% | 1.00% |
| New Orleans | LA | $1,098 | 0.50% | 1.90% |
| Round Rock | TX | $1,097 | 0.30% | -1.10% |
| Raleigh | NC | $1,096 | 0.70% | 2.60% |
| Chandler | AZ | $1,096 | 0.20% | 2.40% |
| Clearwater | FL | $1,094 | -0.10% | 3.10% |
| Salt Lake City | UT | $1,087 | 0.30% | 6.60% |
| Modesto | CA | $1,085 | 0.30% | 7.70% |
| San Bernardino | CA | $1,084 | 0.20% | 3.50% |
| Gilbert | AZ | $1,083 | 0.30% | 3.30% |
| Milwaukee | WI | $1,083 | 0.30% | 1.40% |
| Brandon | FL | $1,080 | 0.30% | 0.70% |
| Irving | TX | $1,075 | 0.00% | 2.50% |
| Henderson | NV | $1,071 | 0.40% | 2.00% |
| West Jordan | UT | $1,057 | 0.90% | 4.40% |
| Colorado Springs | CO | $1,048 | 1.20% | 10.10% |
| West Valley City | UT | $1,045 | 0.60% | 5.40% |
| Houston | TX | $1,044 | -0.10% | -0.30% |
| Reno | NV | $1,041 | 1.30% | 8.40% |
| Durham | NC | $1,040 | 0.90% | 1.90% |
| Baton Rouge | LA | $1,035 | -1.00% | 3.00% |
| Stockton | CA | $1,030 | 0.30% | 10.60% |
| Wilmington | NC | $1,024 | 0.10% | 4.20% |
| Murfreesboro | TN | $1,022 | 0.30% | 2.40% |
| Norfolk | VA | $1,021 | 0.70% | 1.30% |
| Savannah | GA | $1,019 | 1.10% | 5.20% |
| Fort Worth | TX | $1,012 | 0.20% | 4.20% |
| Overland Park | KS | $1,007 | -0.30% | 1.80% |
| Greeley | CO | $1,006 | 0.30% | 0.80% |
| Syracuse | NY | $1,000 | 0.20% | 0.90% |
| Peoria | AZ | $986 | 0.30% | 5.50% |
| Grand Prairie | TX | $986 | 0.10% | 2.70% |
| North Charleston | SC | $985 | 0.10% | 7.20% |
| Hampton | VA | $982 | 0.60% | 1.80% |
| Cleveland | OH | $977 | 0.00% | 3.00% |
| Clovis | CA | $976 | 0.30% | 4.40% |
| Richmond | VA | $976 | 0.50% | 2.00% |
| Victorville | CA | $972 | 0.50% | 7.40% |
| Columbia | SC | $971 | -0.30% | 2.30% |
| Odessa | TX | $970 | 2.60% | 5.90% |
| Jacksonville | FL | $970 | 0.50% | 2.30% |
| Boise | ID | $967 | 1.20% | 6.90% |
| San Antonio | TX | $967 | -0.20% | 0.90% |
| Corpus Christi | TX | $955 | 0.20% | -1.50% |
| Knoxville | TN | $951 | 1.00% | 5.10% |
| Rochester | NY | $951 | 0.20% | 3.30% |
| Detroit | MI | $939 | 0.00% | 6.00% |
| Waco | TX | $938 | -0.20% | 4.80% |
| Fresno | CA | $938 | 0.30% | 4.60% |
| Lakeland | FL | $937 | 0.20% | 0.30% |
| Salem | OR | $935 | 0.60% | 7.10% |
| Buffalo | NY | $933 | 0.20% | 9.40% |
| Arlington | TX | $933 | 0.60% | 6.30% |
| Garland | TX | $932 | 0.10% | 3.30% |
| Grand Rapids | MI | $919 | 0.30% | 2.00% |
| Lubbock | TX | $918 | -0.40% | 0.30% |
| Mesquite | TX | $917 | -0.20% | 4.60% |
| Kansas City | MO | $917 | 0.20% | 3.10% |
| Chattanooga | TN | $916 | 1.10% | 3.60% |
| Bakersfield | CA | $913 | 0.40% | 2.40% |
| Las Vegas | NV | $911 | 0.30% | 3.80% |
| Birmingham | AL | $910 | 0.20% | 1.60% |
| Cincinnati | OH | $907 | 0.20% | 0.60% |
| Phoenix | AZ | $902 | 0.30% | 3.70% |
| Newport News | VA | $899 | 0.70% | 1.00% |
| North Las Vegas | NV | $898 | 0.20% | 1.00% |
| Lincoln | NE | $885 | 0.30% | 0.70% |
| Olathe | KS | $881 | 0.10% | 4.80% |
| Louisville | KY | $881 | 0.10% | 3.40% |
| Waterbury | CT | $881 | 0.00% | 1.60% |
| Spokane | WA | $870 | 0.70% | 7.50% |
| Lexington | KY | $869 | 1.20% | 3.20% |
| Metairie | LA | $865 | -0.20% | 1.20% |
| Norman | OK | $864 | -0.50% | -1.60% |
| Mesa | AZ | $862 | 0.20% | 2.40% |
| South Bend | IN | $859 | 0.10% | 4.10% |
| St. Louis | MO | $859 | 0.10% | -0.20% |
| Omaha | NE | $854 | 0.60% | 1.10% |
| Columbus | OH | $853 | 0.50% | 2.60% |
| Des Moines | IA | $838 | 0.70% | 4.90% |
| Columbus | GA | $837 | 0.00% | 1.30% |
| Sterling Heights | MI | $835 | -0.20% | 0.20% |
| Pasadena | TX | $827 | -0.10% | 5.90% |
| Glendale | AZ | $824 | 0.10% | 2.70% |
| Greensboro | NC | $823 | 0.40% | 2.10% |
| Albuquerque | NM | $813 | 0.00% | 2.40% |
| Indianapolis | IN | $808 | 0.40% | 3.10% |
| Akron | OH | $801 | -0.40% | 2.00% |
| Broken Arrow | OK | $793 | 0.50% | -2.70% |
| Mobile | AL | $792 | 0.30% | 1.50% |
| Paradise | NV | $791 | 0.50% | 3.80% |
| Winston-Salem | NC | $776 | 0.40% | 5.00% |
| Tucson | AZ | $776 | 0.50% | 4.30% |
| Little Rock | AR | $773 | -0.30% | 1.20% |
| McAllen | TX | $772 | 1.00% | -0.10% |
| Kansas City | KS | $765 | 0.30% | 2.30% |
| Macon | GA | $762 | -0.70% | 1.60% |
| Augusta | GA | $760 | 0.00% | 1.20% |
| Las Cruces | NM | $759 | 0.30% | 2.70% |
| Lansing | MI | $758 | 0.00% | 0.40% |
| Warren | MI | $754 | 0.10% | 1.20% |
| High Point | NC | $753 | 0.30% | 1.20% |
| Jackson | MS | $750 | 0.00% | 3.00% |
| El Paso | TX | $741 | 0.10% | -1.20% |
| Memphis | TN | $733 | 0.40% | 1.20% |
| Amarillo | TX | $728 | -0.50% | -0.70% |
| Dayton | OH | $725 | 0.00% | 1.80% |
| Oklahoma City | OK | $713 | -0.40% | -2.90% |
| Independence | MO | $709 | 0.00% | 2.80% |
| Fort Wayne | IN | $701 | 0.90% | 2.60% |
| Killeen | TX | $696 | -0.30% | 0.60% |
| Brownsville | TX | $692 | -1.30% | 1.30% |
| Tulsa | OK | $665 | -0.30% | -2.80% |
| Toledo | OH | $661 | -0.30% | 0.50% |
| Wichita | KS | $633 | 0.50% | 1.40% |
About RentCafe and How We Compiled the Data
RentCafe is a nationwide apartment search website that enables renters to easily find apartments and houses for rent throughout the United States.
To compile this report, RentCafe’s research team analyzed rent data across the 250 largest cities in the US. The report is exclusively based on apartment data related to buildings containing 50 or more units.
Rent data was provided by Yardi Matrix, an apartment market intelligence source and RentCafe’s sister company which researches and reports on all multifamily properties of 50+ units across 124 markets in the United States, as well as office, industrial, and self storage properties. Rental rate coverage is for Market Rate properties only. Fully Affordable properties are not included in the Yardi Matrix rental surveys and are not reported in rental rate averages.
Starting with the January rent survey, Yardi Matrix is using a methodology that incorporates more properties into the sample which caused slight changes in overall rents and year-over-year changes compared to the previous reports. We expect this methodology adjustment to produce more accurate averages at the national and metro levels.
*National averages include 121 markets across the U.S., as reported by Yardi Matrix.
Share this article:

Amalia Otet
Amalia Otet leads publishing and content for Yardi products, where she turns real estate data and market trends into stories that inform and inspire. Outside of work, Amalia strives to live beautifully - one green step at a time.
Sign up for The Ready Renter newsletter
Get our free apartment hunting guide — plus tips, trends and research.
")

")

Related posts

Your first month of solo apartment life: A week-by-week guide for new renters
Moving into your own apartment is one of the most exciting milestones of young adulthood. But it’s also one of the most overwhelming. Between setting…

5 questions to ask before renting an apartment in Asheville, NC
Asheville has earned its reputation for good reason. The food scene punches well above its weight, the Blue Ridge Mountains are a short drive away…
June 2026 self storage report: Rents slip 1.5% annually, edge up 0.7% from May
National street rates averaged $135 in June 2026, down 1.5% year-over-year but up 0.7% from May, as the summer moving season provides a modest seasonal…
Subscribe to
The Ready Renter newsletter


